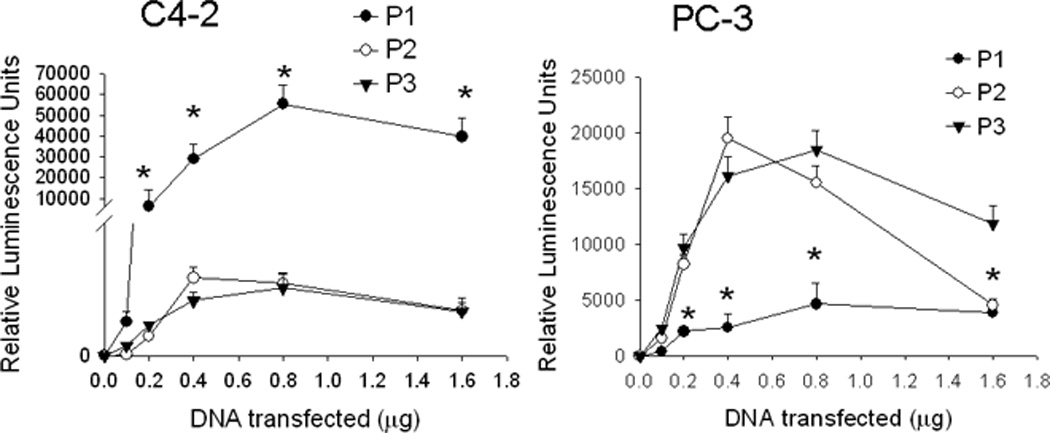
Figure 1. PTHrP promoter usage in C4-2 and PC-3 cells.

Cells were transfected with the indicated amounts of promoter-driven luciferase reporter construct DNA for promoters 1, 2 and 3 (P1, P2 or P3). Luciferase activity was measured after 24 h. Control (empty vector) values were subtracted from the respective firefly and Renilla luciferase values. Values were normalized to Renilla luciferase activity, and are expressed as Relative Luminescence Units. P = promoter. Each point is the mean ± SEM of three experiments. * = Significantly different from the P2 and P3 values (P < 0.001).
