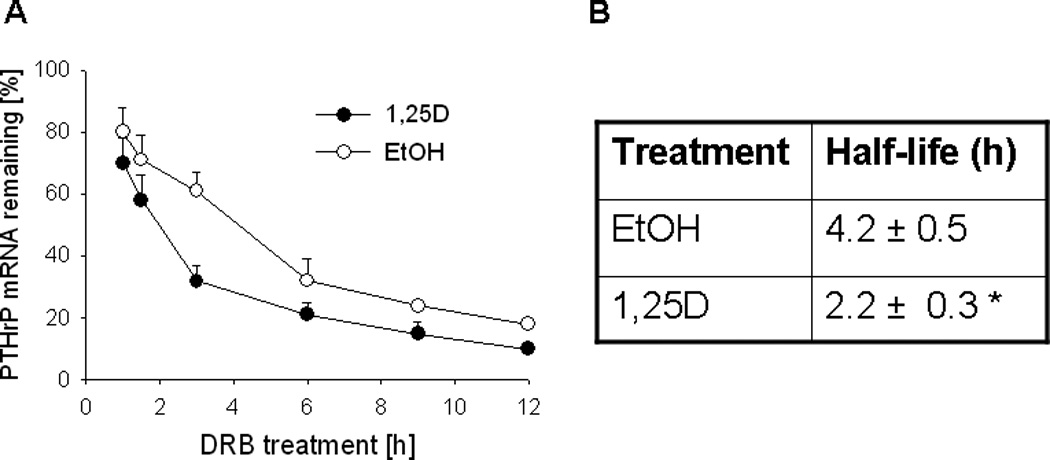
Figure 3.

(A) Decay profile of PTHrP mRNA in PC-3 cells treated with 1,25D or ethanol The cells were treated with 1,25D (10−7 M) or ethanol (EtOH, vehicle control) for 48 h, followed by the transcriptional inhibitor 5,6-dichlororibofuranosylbenzimidazole (DRB). PTHrP mRNA levels were measured by reverse transcription/real-time PCR at the indicated time points after addition of DRB, and are expressed as a percentage of the value obtained at the time of DRB addition (0 h), set at 100%. Each point represents the mean ± S.E.M. of three independent experiments. (B) Comparison of the PTHrP mRNA half-life in 1,25D- and ethanol-treated cells. The values were obtained from the data presented in (A). * = Significantly different from the vehicle control value (P < 0.001).
