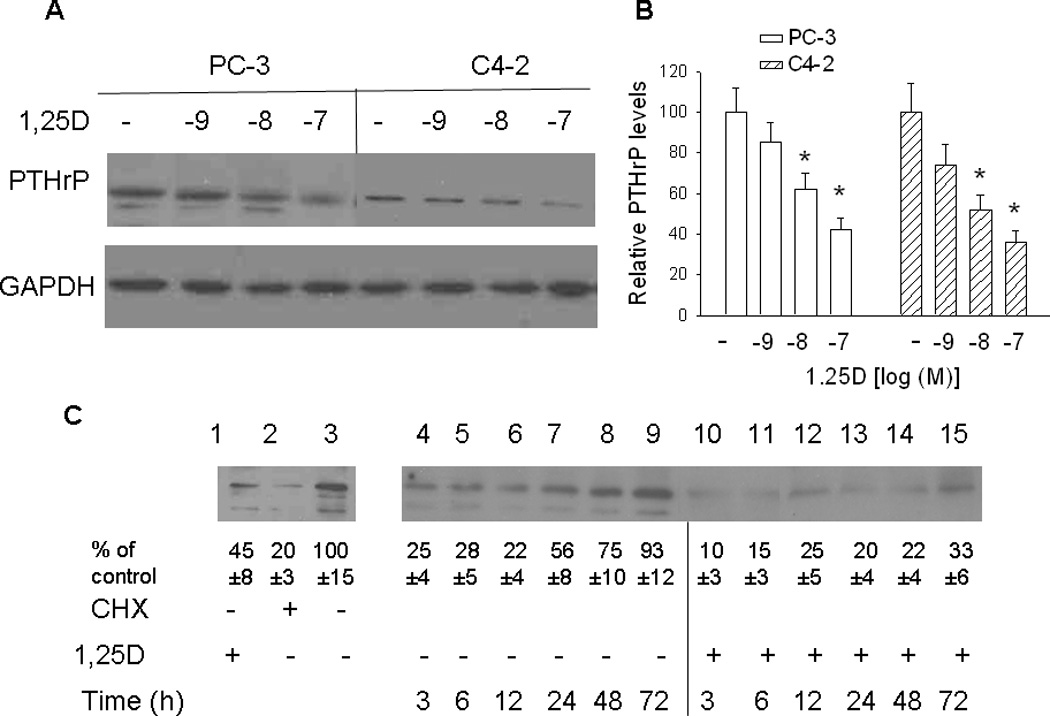
Figure 4. Effect of 1,25D on PTHrP protein levels, analyzed by Western blot analysis. (A and B) PTHrP levels in PC-3 and C4-2 cells treated with the indicated concentrations [log[(M)] of 1,25D.

After 48 h, lysates were prepared for Western blotting. (A) Representative Western blot. (B) The relative PTHrP levels were obtained after densitometric scanning of the Western blots and normalization to GAPDH. The control value (−, ethanol treated cells) was set at 100%. In PC-3 cells, only the major band was analyzed. In C4-2 cells, only one band was evident. Each bar represents the mean ± S.E.M. of three independent experiments. * = Significantly different from the vehicle control (P < 0.001). (C) Recovery of PTHrP expression in PC-3 cells treated with 1,25D or ethanol. Lane 1, PTHrP levels in cells treated with 10−7 M 1,25D for 72 h; lane 2, PTHrP levels in cells treated with the protein synthesis inhibitor cycloheximide (CHX) for 6 h; lane 3, PTHrP levels in control (ethanol-treated) cells. Lanes 4–15. PC-3 cells were pre-treated with CHX for 6 h, then with 10−7 M 1,25D (+ 1,25D lanes) or with ethanol (vehicle control; − 1,25D lanes). At the indicated time points, lysates were prepared for Western blotting. The relative PTHrP levels were obtained after densitometric scanning of the Western blots and normalization to GAPDH. The control value (−, ethanol treated cells) was set at 100%. The mean and S.E.M. values represent data from three independent experiments.
