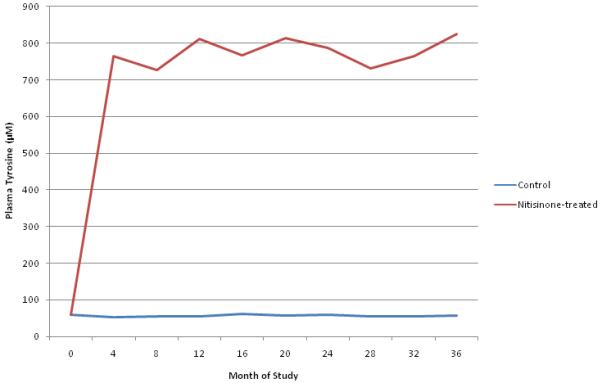
Figure 6. Plasma tyrosine concentrations in control and nitisinone-treated alkaptonuria patients over time.

Mean plasma tyrosine levels (μM) measured at each visit over the 36 month study period. The red line is the mean for the nitisinone-treated group. The blue line represents the mean for the control group.
