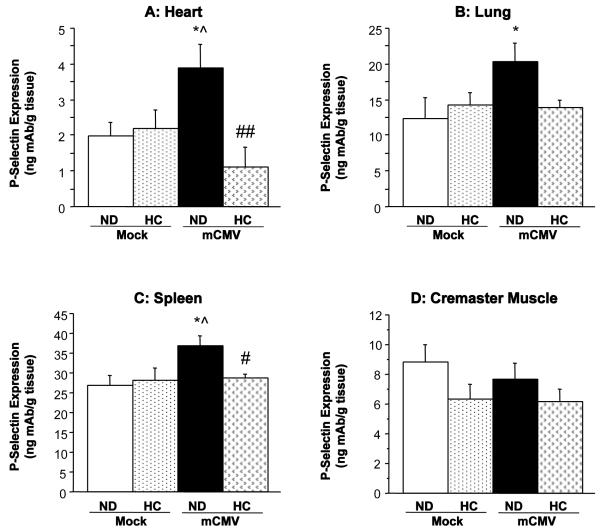
Figure 1.
P-selectin expression, as measured by DRL, in (A) heart, (B) lung, (C) spleen and (D) cremaster muscle of WT mice 11 wks after exposure to mock inoculum or mCMV. Mice were either maintained on ND, or placed on HC at 5 wks p.i. for 6 wks. * P<0.05 vs. Mock-ND; ^ P<0.05 vs. Mock-HC; # P<0.05 vs. mCMV-ND; ## P<0.01 vs. mCMV-ND.

