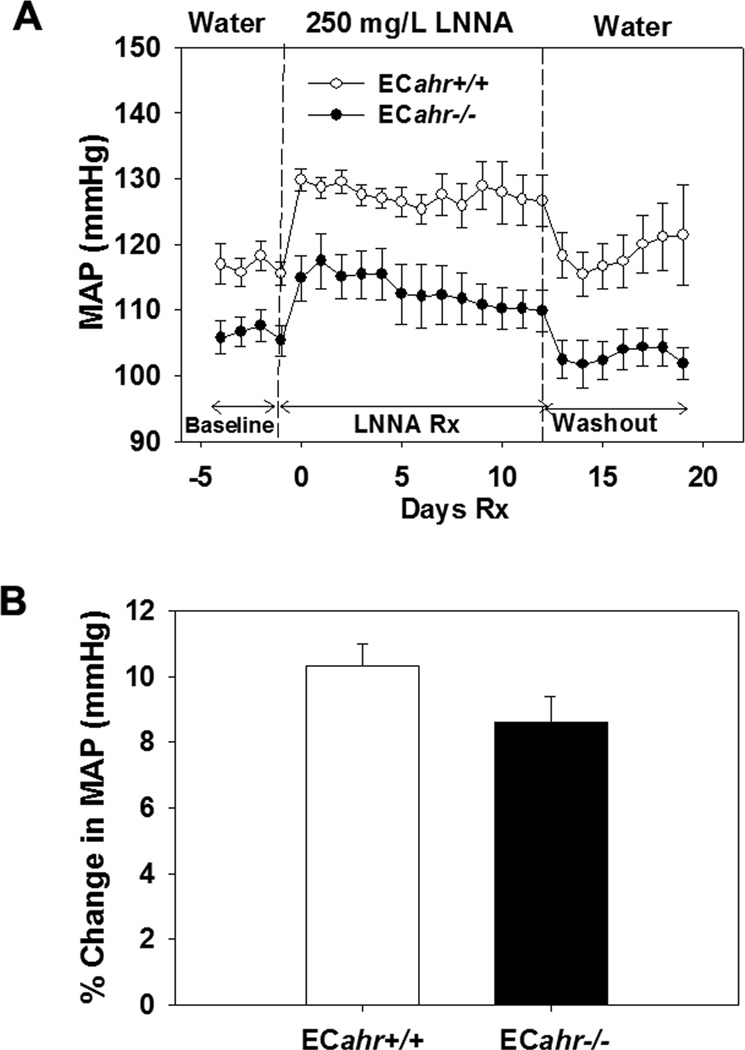
Figure 3.
ECahr−/− mice exhibit normal responses to NOS inhibition by LNNA in vivo. (A) Change in MAP after treatment with 250 mg/L LNNA in drinking water of male ECahr−/− and ECahr+/+ mice. (B) Percent change in MAP after treatment with 250 mg/L LNNA. Data represent mean ± SEM and were analyzed by two-way, repeated measures ANOVA, using post hoc Holm-Sidak comparisons; *p < 0.05, compared to ECahr+/+ (A), and by Student’s t-test (B) (n=8/genotype for all experiments).

