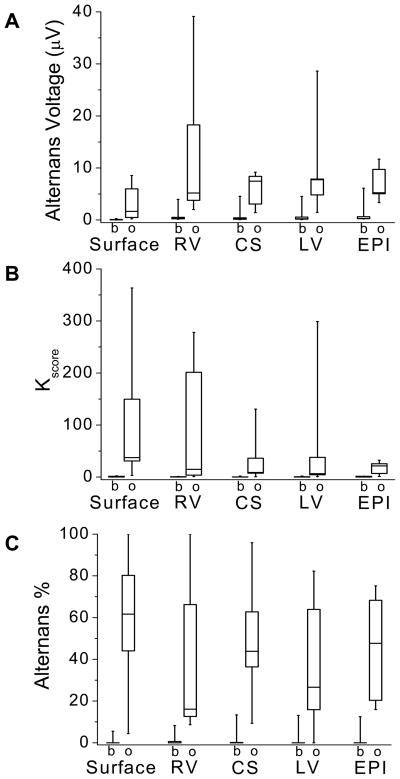
Figure 3.
Alternans voltage, Kscore, and alternans percent at baseline (b) and immediately following circumflex coronary artery balloon occlusion (o) for body surface and RV, CS, LV and EPI unipolar intracardiac leads. Boxes define the 25%-median-75% data range, and vertical whiskers extend to the minimum and maximum. (A) Alternans voltage, (B) Kscore, and (C) alternans percent. The alternans percent is equal to the total number of positive RA sequences divided by the total number of positive and negative sequences. Alternans voltage, Kscore, and alternans percent all increased following acute ischemia induction, (ANOVA p < 0.0001, F=37.297, df=1, N=45; p < 0.0001, F=20.078, df=1, N=45; and p < 0.0001, F=105.481, df=1, N=45, respectively, where N represents the overall sample size).

