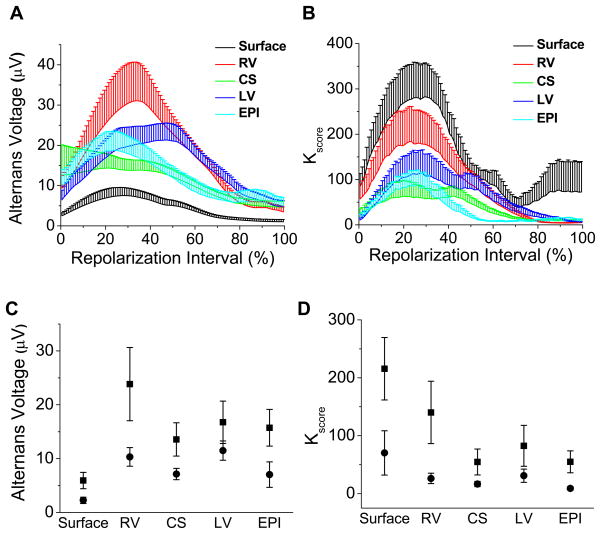
Figure 5.
Temporal characteristics of repolarization alternans during the repolarization interval, which extends from the beginning of the ST segment (0%) to the end of the T wave (100%). (A) Alternans voltage, plotted at each point in the repolarization interval, from 0% to 100%, for each of the body surface and unipolar RV, CS, LV, and EPI leads, compiled across all study subjects for all RA-positive segments. The alternans voltage takes its maximum at 31.4% ± 9.8% of the repolarization interval when averaged across all leads. (B) Kscore, plotted as in (A). Kscore takes its maximum at 29.0% ± 8.3% of the repolarization interval when averaged across all leads. For (A) and (B), error bars are s.e.m., shown only as positive deflections to improve data visualization. (C) Comparison of the mean alternans voltage in the first half (0–50%) of the repolarization interval (squares) versus the second half (50–100%) of the repolarization interval (circles). Error bars are s.e.m. The alternans voltage is greater in the first half of the repolarization interval than the second half (ANOVA p=0.0007, F=12.501, df=1, N=39, where N represents the overall sample size). (D) Comparison of the mean Kscore in the first half of the repolarization interval (squares) versus the second half of the repolarization interval (circles). Error bars are s.e.m. Kscore is greater in the first half of the repolarization interval than the second half (ANOVA p=0.0002, F=15.247, df=1, N=39).


