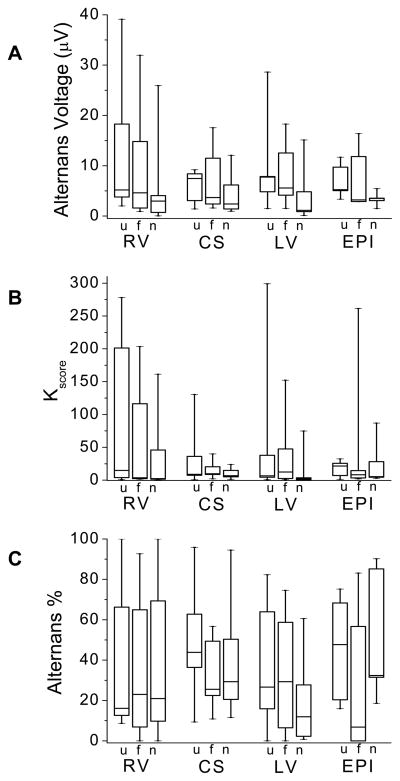
Figure 6.
Evaluation of unipolar (u), far-field bipolar (f), and near-field bipolar (n) intracardiac RA following circumflex coronary artery balloon occlusion for (A) alternans voltage, (B) Kscore, and (C) alternans percent. Boxes define the 25%-median-75% data range, and vertical whiskers extend to the minimum and maximum. (A) Alternans voltage varies with sensing configuration (ANOVA p=0.007, F=5.219, df=2, N=35, where N represents the overall sample size). Unipolar and far-field bipolar alternans voltage were significantly greater than near-field (p=0.010 and 0.031, respectively). (B) No statistical difference in Kscore was observed as a function of sensing configuration (ANOVA p=0.097, F=2.395, df=2, N=35). (C) No statistical difference in alternans percent was observed as a function of sensing configuration (p=0.350, F=1.061, df=2, N=35).

