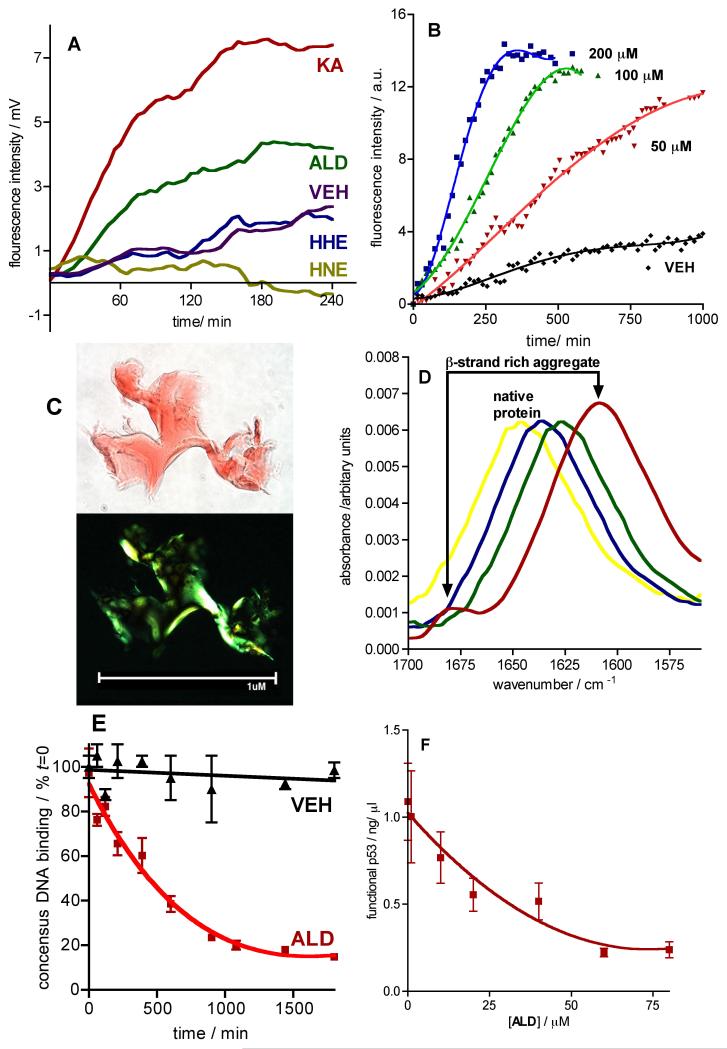
Figure 2. Lipid Aldehydes KA and ALD, but not HNE and HHE, Induce Amyloidogenesis of and Dysfunction of Recombinant His6-p53.
a Graph of ThT fluorescence vs time during quiescent incubation of His6-p53 (0.8 mg/ml) in PBS (pH 7.4) with ethanol (0.1 % v/v) co-solvent in the presence of either KA, ALD, HNE or HHE (each at 100 μM). Data is reported as the mean fluorescence emission (Ex: 440 nm; EM: 485 nm) of duplicate experiments. b Graph of KA concentration-dependent (0-200 μM) quiescent aggregation of His6-p53 (0.8 mg/ml) in PBS (pH 7.4) with ethanol (0.1 % v/v) co-solvent, as measured by ThT fluorescence. Data is reported as the mean fluorescence (Ex: 440 nm; EM: 485 nm) of duplicate experiments. Data is fitted to a third order polynomial using Graphpad Prism v4.0 for MAC. c Optical microscope images (100 x) obtained under normal (upper) and cross-polarized (lower) light of aggregates generated by incubation of His6-p53 (0.8 mg/mL) with KA (25 μM) for 5 h, followed by centrifugation and staining with Congo Red (100 μM). d FTIR spectra at times [0 min (yellow), 300 min (blue), 800 min (green) and 1200 min (red)] during the quiescent aggregation of His6-p53 (0.5 mg/ml) in D2O with KA (100 μM). e Graph of functional p53 (as a percent of t = 0) vs. time during the quiescent aggregation of His6-p53 (0.8 mg/ml) in the presence of ALD (50 μM) or VEH (ethanol 0.1 % v/v). Data are means ± SEM of at least duplicate determinations. Data for VEH is fitted to a linear regression analysis (r2 = 0.992); data for ALD is fitted to a single-phase exponential decay using Graphpad prism v 4.0. f Graph of functional p53 (in ng/ml) vs. [ALD] during a 2 h quiescent aggregation of His6-p53 (0.8 mg/ml) in the presence of ALD (0-80 μM). Data are reported as the mean ± SEM of at least duplicate determinations. Data is fitted to a single-phase exponential decay using Graphpad prism v 4.0. See also Figure S1.

