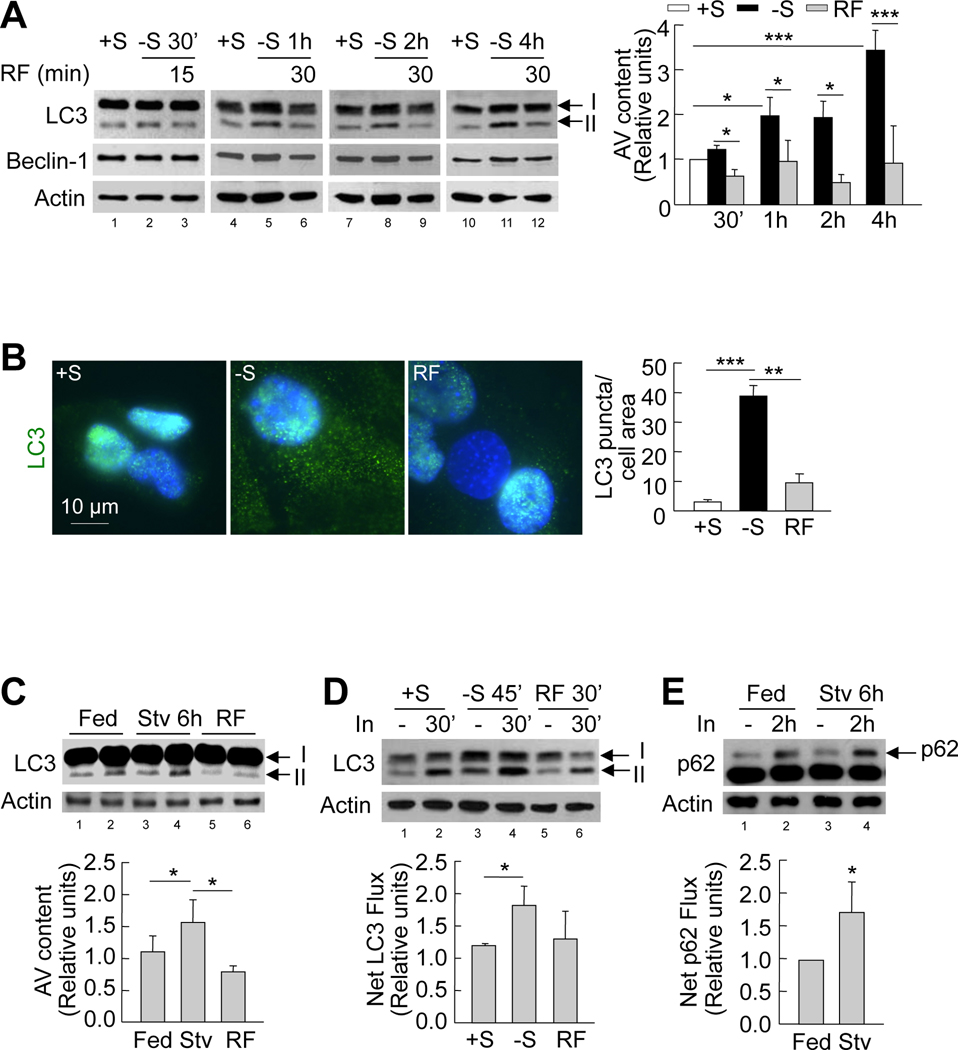
Figure 1. Starvation induces autophagy in the hypothalamus.
(A) Immunoblots for LC3 and Beclin-1 from GT1–7 cells in presence (+S) or absence of serum (−S), or serum refed (RF) after serum removal for indicated times. Values for LC3-II represent autophagic vacuole (AV) content relative to +S (n=3). See also Figure S1. (B) Indirect immunofluorescence for LC3 (green) in GT1–7 cells in +S or −S for 1h, or RF for 30min following serum removal. DAPI-stained nuclei are in blue. Values represent LC3 puncta per cell area, and are mean+SE of 20 different cells in each experiment, n=3. (C) Immunoblots for LC3 in mediobasal hypothalamus (MBH) lysates from fed (lanes 1, 2), 6h-starved (Stv) (lanes 3, 4), or starved mice subjected to refeeding for 3h (RF) (lanes 5, 6). Values depict AV content, calculated as in A (n=5). (D) Immunoblots for LC3 from GT1–7 cells in +S or −S or RF following serum removal for times indicated. Cells were treated with (lanes 2, 4, 6) or without lysosomal inhibitors (In) (lanes 1, 3, 5) for 30min. Values represent net LC3 flux determined by subtracting LC3-II densitometric value of untreated samples from corresponding In-treated sample (n=4). (E) Immunoblot for p62 from MBH explants of fed (lanes 1, 2) and 6h-starved (Stv) (lanes 3, 4) mice cultured in presence or absence of lysosomal inhibitors (In) for 2h. Values represent net p62 flux (n=4). Values are mean+SE. *p<0.05, **p<0.01, ***p<0.001.

