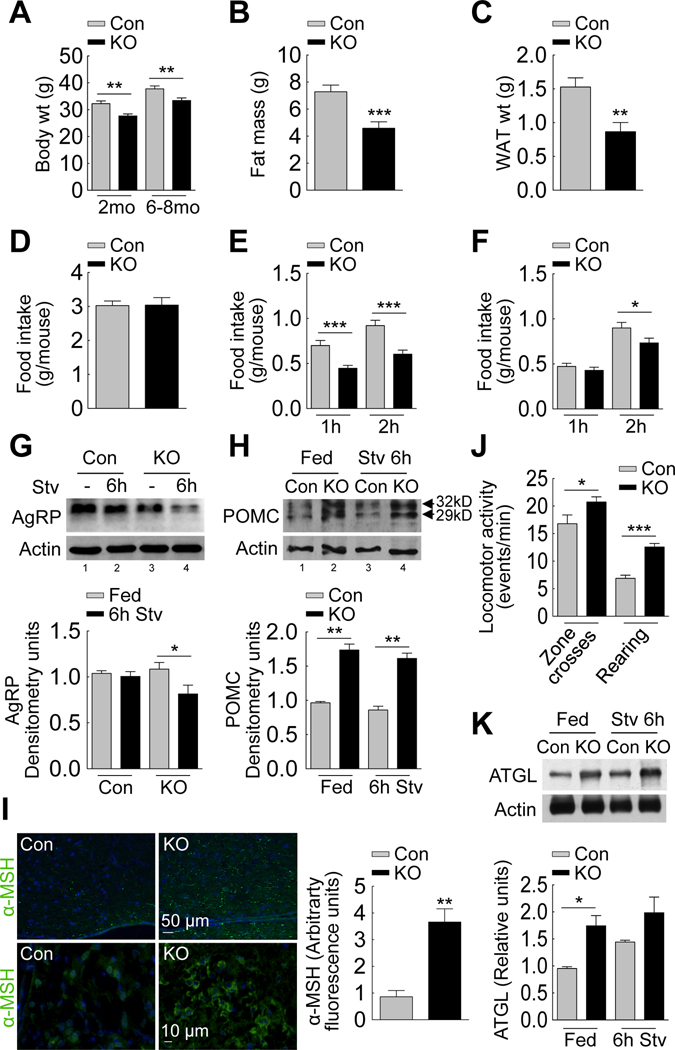
Figure 2. Food intake and energy balance in mice knock-out for atg7 in AgRP neurons.
(A) Body weights of 2 month (mo) (n=10–12) and 6–8 mo-old control (Con) and Atg7F/F-AgRP-Cre (KO) mice (n=12–15). (B) Total body fat mass of 6–8 month old Con and KO mice (n=10–12). (C) Epididymal fat weights of 6–8 month old Con and KO mice (n=15–16). See also Figure S2D. (D) Food intake over 24h by Con and KO mice (n=27–31). (E) Food intake by 6h- (n=12–24), and (F) 24h-starved Con and KO mice when refed for indicated times (n=15–18). (G) Immunoblot for AgRP from mediobasal hypothalamus (MBH) of Con (lanes 1, 2) and KO (lanes 3, 4) mice fed or starved (Stv) for 6h. Values represent densitometric values for AgRP (n=10). See also Figure S2F–G. (H) Immunoblot for POMC preproprotein from MBH of fed Con and KO (lanes 1, 2) and 6h-starved Con and KO (lanes 3, 4) mice (n=6). (I) Indirect immunofluorescence (at similar exposure times) for α-MSH (green) in MBH sections from Con and KO mice (n=3). (J) Locomotor activity reflecting “zone crosses” and “rearing” by fed Con and KO rodents (n=14–19). (K) Immunoblot for ATGL from adipose tissues of fed Con and KO (lanes 1, 2) and 6h-starved Con and KO (lanes 3, 4) mice. Values represent densitometric values for ATGL (n=3–4). Values are mean+SE. *p<0.05, **p<0.01, ***p<0.001.

