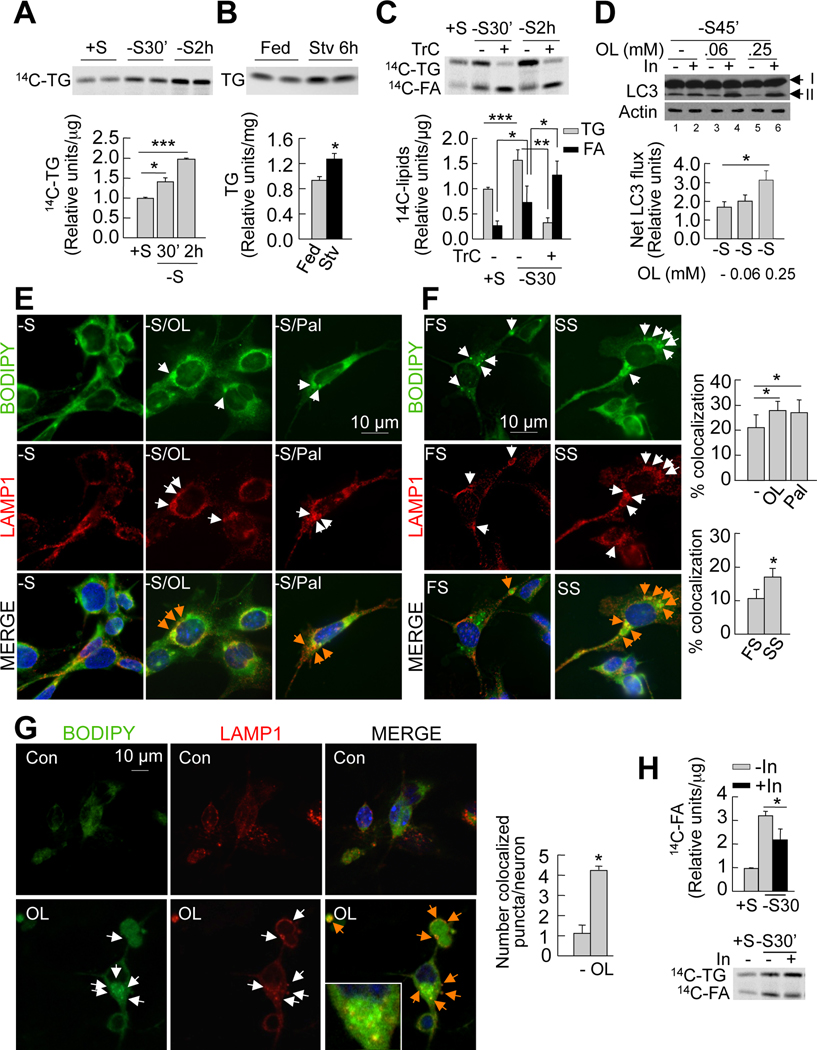
Figure 3. Fatty acid uptake during starvation induces hypothalamic autophagy.
(A) Thin layer chromatogram (TLC) of 14C-triglycerides (14C-TG) from GT1–7 cells in presence (+S) or absence (−S) of serum for the indicated times. Relative densitometric values represent 14C-triglycerides per µg protein (n=3). (B) TLC of TG extracted from mediobasal hypothalamus (MBH) from fed and 6hstarved (Stv) mice. Relative densitometric values represent triglycerides per mg tissue weight (n=4–5). See also Figures S3A and S3B. (C) TLC of 14C-TG and 14C-fatty acids (14C-FA) from GT1–7 cells maintained in +S or −S treated with or without triacsin C (TrC) for indicated times. Relative densitometric values represent corresponding 14C-lipid per µg protein (n=5). (D) Immunoblot for LC3 from GT1–7 cells cultured in −S and treated with 0.06 or 0.25mM oleic acid for indicated times. Cells were treated with or without lysosomal inhibitors (In) for 30min. Values represent net LC3 flux determined by subtracting LC3-II densitometric value of untreated samples from corresponding Intreated samples (n=3). See also Figure S3D. (E) Immunofluorescence for BODIPY/LAMP1 in GT1–7 cells cultured in −S and co-treated with or without 0.25mM oleic (−S/OL) or palmitic acid (−S/Pal) for 30min, and in cells (F) cultured in 1% serum from fed (FS) or 24h-starved (SS) rats for 30min.Values represent %colocalization between BODIPY and LAMP1 (orange arrows), and are mean+SE of 20 different cells in each experiment, n=3. See also Figure S3H. (G) Confocal images for BODIPY/LAMP1 in primary hypothalamic neurons treated with or without 0.25mM oleic (OL). Values represent number of colocalized (orange arrows) puncta, and are mean+SE of more than 20 different cells in each experiment, n=3. (H) TLC of 14C-TG and 14C-FA from GT1–7 cells in +S or −S and treated with lysosomal inhibitors (In) for 30min. Relative densitometric values represent 14C-FA per µg protein (n=3). Values are mean+SE. *p<0.05, **p<0.01, ***p<0.001.

