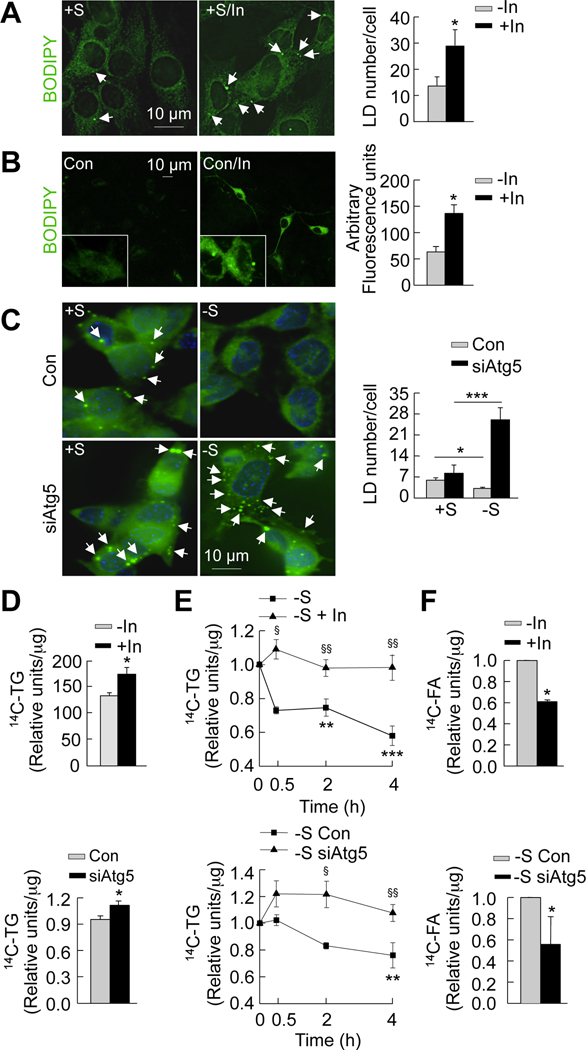
Figure 5. Inhibition of autophagy in hypothalamic cells promotes neuronal lipid accumulation.
(A) BODIPY staining (acquired at similar exposure times) in serum-fed GT1–7 cells (+S) cultured in presence or absence of lysosomal inhibitors (In) for 30min. Values represent lipid droplet (LD) number per cell, and are mean+SE for 20 different cells, n=3. (B) BODIPY staining (acquired at similar exposure times) in primary hypothalamic neurons cultured in presence or absence of lysosomal inhibitors (In) for 4h. Values represent arbitrary fluorescence intensity, and are mean+SE for 20 different cells, n=3. (C) BODIPY staining in control (Con) and autophagy-deficient (siAtg5) GT1–7 cells in +S or −S for 30min. Values represent LD number per cell, and are mean+SE for 20 different cells, n=3. (D) Relative densitometric values representing 14C-triglycerides (14C-TG) per µg protein calculated from thin layer chromatograms from GT1–7 cells cultured in +S for 4h (Con) or subjected to pharmacologic (In; Top) or genetic (siAtg5; Bottom) inhibition of autophagy. Values are mean+SE, n=3. (E) Decay assays for 14C-TG in GT1–7 cells chased in absence of serum for the indicated times (Con) or following pharmacologic (In; Top) or genetic (siAtg5; Bottom) inhibition of autophagy. Relative densitometric values represent residual 14C-TG per µg protein, and are mean+SE, n=4. (F) Relative densitometric values representing 14C-fatty acid (14C-FA) per µg protein calculated from thin layer chromatograms from GT1–7 cells cultured in −S for 30min (Con) or subjected to pharmacologic (In; Top) or genetic (siAtg5; Bottom) inhibition of autophagy. Values relative to −S control are mean+SE, n=3. *p<0.05, **p<0.01, and ***p<0.001. §p<0.05, §§p<0.005 compared to corresponding −S or −S Con.

