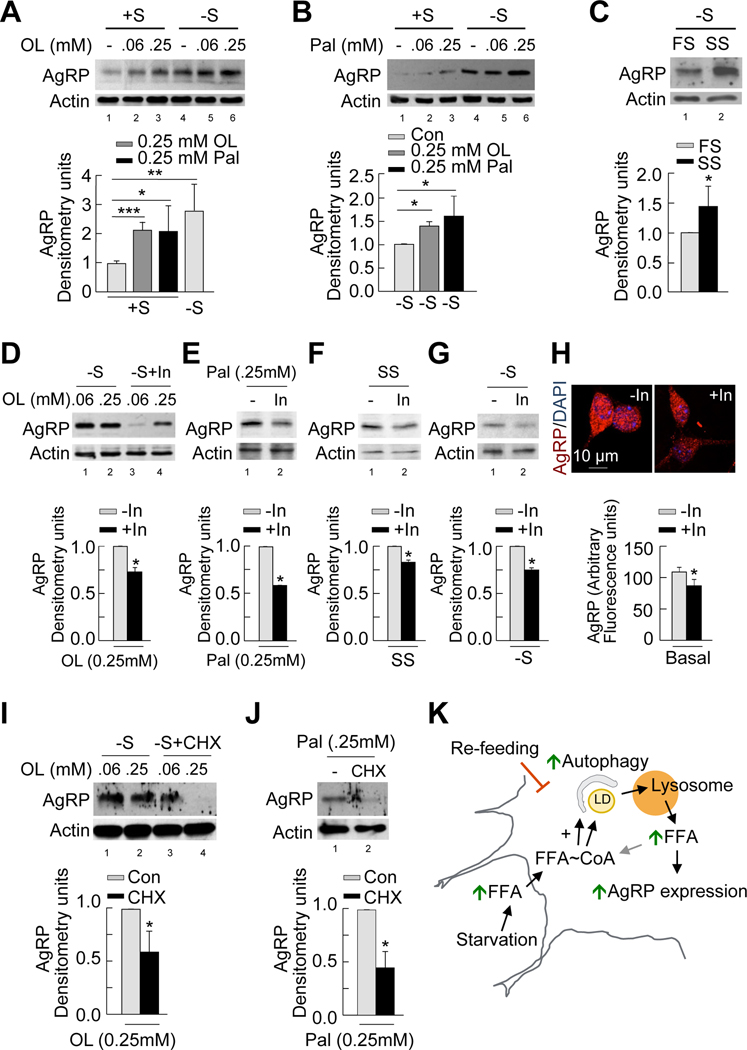
Figure 6. Autophagy-derived intracellular free fatty acids promote AgRP expression.
(A–C) Immunoblot for AgRP from GT1–7 cells in presence (+S) or absence of serum (−S) for 1h and treated without or with 0.06 and 0.25mM oleic acid (OL) (A) or palmitic acid (Pal) (B) or treated with 1% fed (FS) or starved rat serum (SS) (C). Densitometric values of AgRP normalized to untreated +S (lower panel: left); normalized to untreated −S (lower panel: middle); and normalized to FS (lower panel: right). Values are mean+SE, n=3. (D–G) Top: Immunoblot for AgRP from GT1–7 cells in −S in absence or presence of lysosomal inhibitors (In) for 1h and treated with 0.06 and 0.25mM OL (D), 0.25mM Pal (E), 1% SS (F), or untreated (G). Bottom: Densitometric values for AgRP normalized to In-untreated cells. Values are mean+SE, n=3. See also Figure S5. (H) Immunostaining for AgRP (acquired at similar exposure times) in primary hypothalamic neurons cultured in presence or absence of lysosomal inhibitors (In) for 4h. Values represent arbitrary fluorescence intensity for AgRP, and are mean+SE for 20 different cells, n=3. (I–J) Top: Immunoblot for AgRP from serum-deprived GT1–7 cells in absence or presence of the protein synthesis inhibitor, cycloheximide (CHX) for 1h following treatment with 0.06 and 0.25mM OL (I), or 0.25mM Pal (J). Bottom: Densitometric values for AgRP normalized to CHX-untreated cells. Values are mean+SE, n=3. (K) Proposed model depicting role of autophagy in hypothalamic AgRP expression. *p<0.05, **p<0.01, ***p<0.001.

