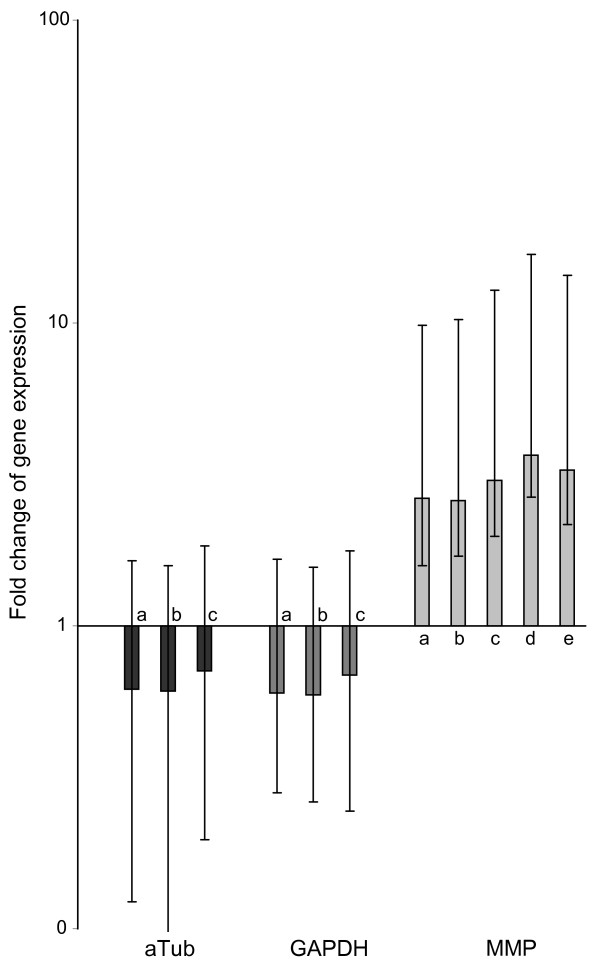
Figure 2.
Differential expression of aTub, GAPDH and MMP evaluated with REST using different normalization strategies. Program and genes used as reference genes for normalization: a) geNorm: Tbp/Xbp1/CAPON; b) NormFinder I: Tbp/Xbp1; c) NormFinder II: Xbp1/Stx16; d) the classical house-keeping genes Tbp/aTub/GAPDH; e) all genes, i.e.: Tbp/aTub/GAPDH/Stx16/Xbp1/CAPON. Boxes represent the interquartile range, or the middle 50% of observations. The dotted line represents the median gene expression. Whiskers represent the minimum and maximum observations.

