Figure 2.
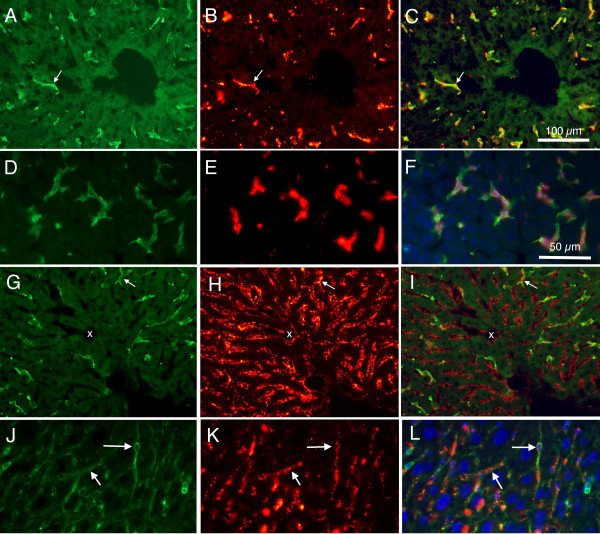
Fluorescence photomicrographs from P30 and P15 mouse liver, showing difference in patterns of labeling between large (0.2 μm) and small (0.02) microspheres. A: Alexa 488 labelled F4/80 cells from P30 mouse. B: Same section as in 'A' but viewed using rhodamine optics to reveal large (0.2 μm) fluorescently labelled microspheres. C: Merged image of 'A' and 'B', showing co-localization of F4/80 and large microspheres. D: Higher magnification photomicrograph showing Alexa 488 labelled F4/80 cells from P15 mouse liver. E: Same section as in 'D', viewed using rhodamine optics to reveal large (0.2 μm) fluorescently labelled microspheres. F: Merged image of 'D' and 'E', and also with ultraviolet imaging of DAPI labelled cell nuclei, showing cells co-labelled with F4/80 and microspheres. Note that most microspheres appear associated with F4/80 positive cells. G: Alexa 488 labelled F4/80 positive cells from P30 mouse. H: Same section as in 'G', viewed using rhodamine optics to reveal small (0.02 μm) fluorescently labelled microspheres. I: Merged image of 'G' and 'H', showing a few cells co-labelled with F4/80 and microspheres. Note that most microspheres appear not to be associated with F4/80 positive cells. White arrows indicate double labelled cells; x indicates capillary with red microspheres but absence of F4/80 immunoreactivity. J: Higher magnification photomicrograph showing Alexa 488 labelled CD-34 cells from P15 mouse liver. K: Same section as in 'J', viewed using rhodamine optics to reveal small (0.02 μm) fluorescently labelled microspheres. L: Merged image of 'J' and 'K', and also with ultraviolet imaging of DAPI labelled cell nuclei, showing cells co-labelled with CD-34 and microspheres. Note that most microspheres appear associated with CD-34 positive cells; examples are indicated by white arrows. Calibration bar in 'C' = 100 μm for images A, B, C, G, H, and I. Calibration bar in 'F' = 50 μm for images D, E, F, J, K, and L.

