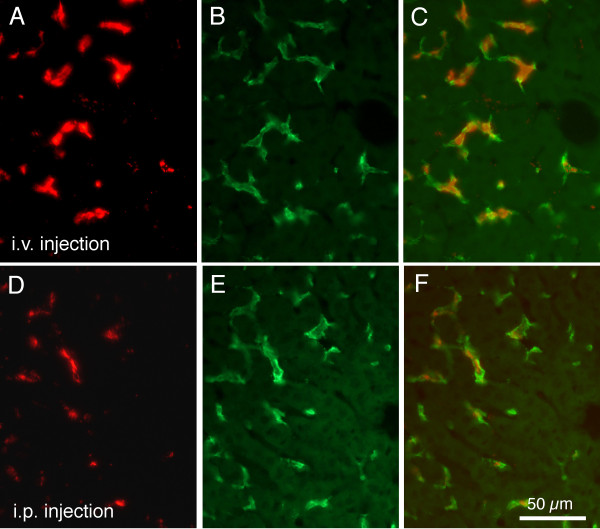
Figure 4.
Fluorescence images allow comparison of results of IV and IP injections. Fluorescence images under rhodamine optics show labelling of mouse liver 1 hr following intravenous (A) or intraperitoneal (D) injections of red labelled large (0.2 μm) microspheres. The same sections were photographed under fluorescein optics (B and E) to show F4/80 immunoreactivity. Merged images in C and F demonstrate co-localization of red microspheres and green immunoreactivity. Calibration bar in F = 50 μm for all images.

