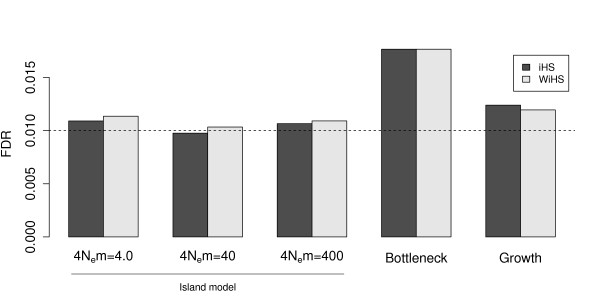
Figure 5.
False discovery rate under different demographic scenarios and parameters. The FDR was estimated as the number of detected sweeps divided by the number of analyzed windows in simulations without selection. The dashed line represent the nominal significance level of 0.01. For each scenario, 200 simulations were conducted.

