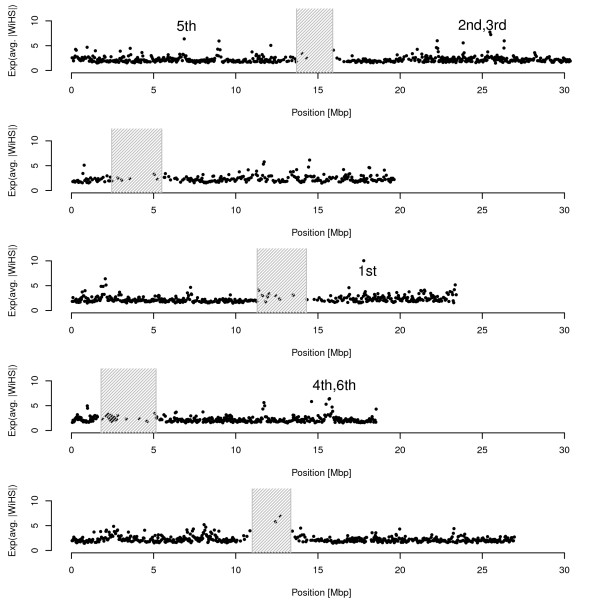
Figure 6.
WiHS results for the A. thaliana data. WiHS was calculated for all SNPs and then the absolute scores were averaged in windows of 50 SNPs. To highlight the outstanding windows, the values were then exponentiated for this figure. The top six windows are labeled in the figure. The shaded regions denote the centromeric regions.

