
Figure 2.
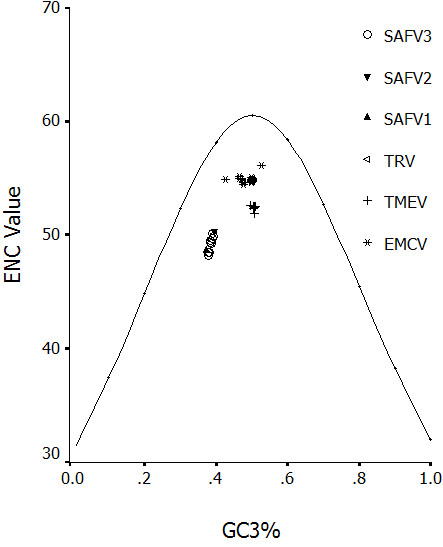
Effective number of codons used in each ORF plotted against the (C+G)3. The continuous curve plots the relationship between (C+G)3. and ENC in the absence of selection. All of spots lie below the expected curve.
Official websites use .gov
A
.gov website belongs to an official
government organization in the United States.
Secure .gov websites use HTTPS
A lock (
) or https:// means you've safely
connected to the .gov website. Share sensitive
information only on official, secure websites.
Effective number of codons used in each ORF plotted against the (C+G)3. The continuous curve plots the relationship between (C+G)3. and ENC in the absence of selection. All of spots lie below the expected curve.