
Figure 4.
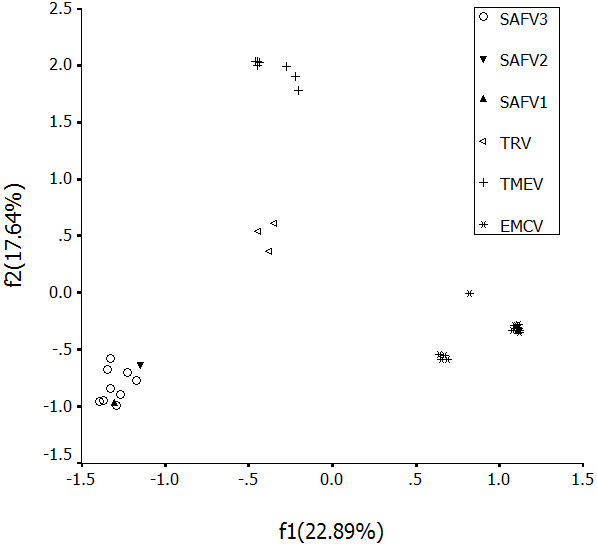
A plot of value of the first and second axis of each complete coding region in COA. The first axis (f'1) accounts for22.89% of the total variation, and the second axis (f'2) accounts for 17.64% of the total variation.
Official websites use .gov
A
.gov website belongs to an official
government organization in the United States.
Secure .gov websites use HTTPS
A lock (
) or https:// means you've safely
connected to the .gov website. Share sensitive
information only on official, secure websites.
A plot of value of the first and second axis of each complete coding region in COA. The first axis (f'1) accounts for22.89% of the total variation, and the second axis (f'2) accounts for 17.64% of the total variation.