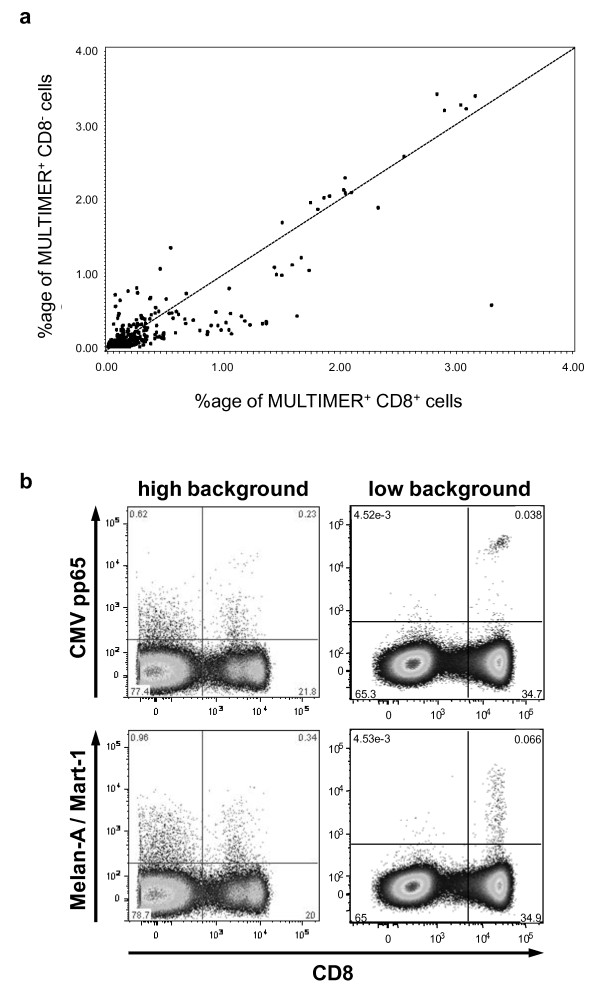
Figure 3.
MULTIMER binding to CD8-positive cells versus MULTIMER binding to CD8-negative cells. (a) The Figure displays the percentage of MULTIMER binding to CD8-negative cells (y-axis) versus the percentage of MULTIMER binding to CD8-positive cells (x-axis) for each staining from a positive donor-antigen combination (DUMP and NO DUMP). (b) The four dot plots illustrate representative experiment results with a high background (left column) and a low background (right column) for the CMV-pp65 MULTIMER (upper row) and the Melan-A MULTIMER (lower row).

