Figure 1.
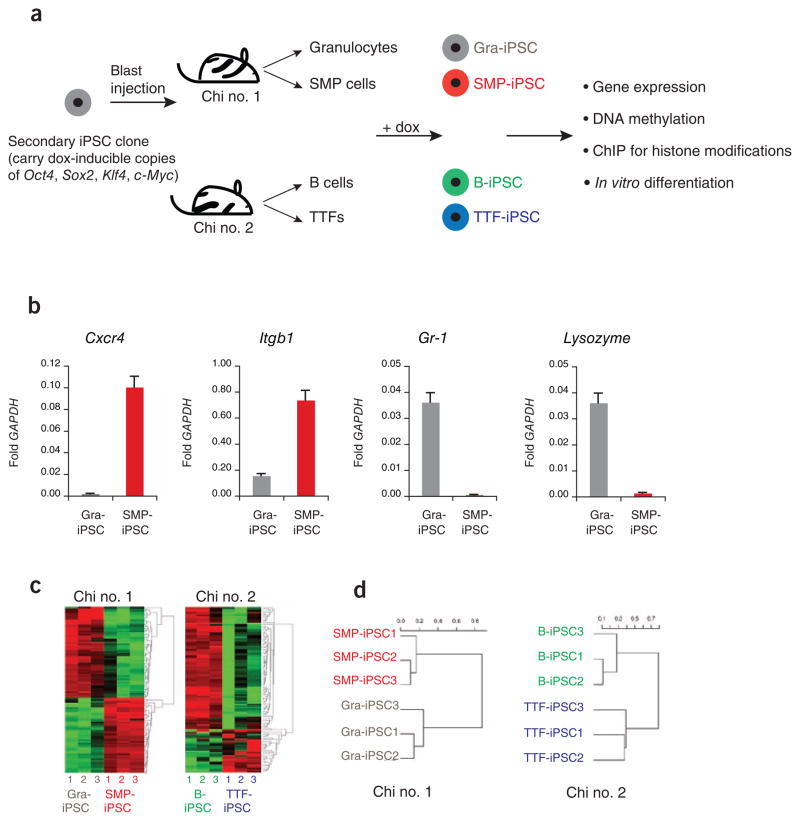
iPSCs derived from different cell types are transcriptionally distinguishable. (a) Flow chart explaining the derivation and analysis of genetically matched iPSCs from different cell types. Secondary iPSCs were first injected into blastocysts to generate chimeric mice, from which the indicated somatic cell types were isolated. Exposure of these cells to doxycycline (dox) then gave rise to iPSCs. ChIP, chromatin immunoprecipitation. (b) Quantification of the expression levels of Cxcr4, Itgb1, Gr-1 and Lysozyme by quantitative PCR in SMP-iPSCs, in red, and Gra-iPSCs, in gray. The values were normalized to GAPDH expression; the error bars depict the s.e.m. (n = 3). (c) Heat map showing top 104 probes with highest variance in their expression levels. Left panel, SMP-iPSCs and Gra-iPSCs derived from chimera no. 1. Right panel, TTF-iPSCs and B-iPSCs derived from chimera no. 2. (d) Hierarchical, unsupervised clustering of iPSC expression profiles using the correlation distance and the Ward method. SMP-iPSCs and Gra-iPSCs were derived from chimera no. 1 (left panel), TTF-iPSCs and B-iPSCs originate from chimera no. 2 (right panel). Chi no. 1, chimera no. 1; chi no. 2, chimera no. 2.

