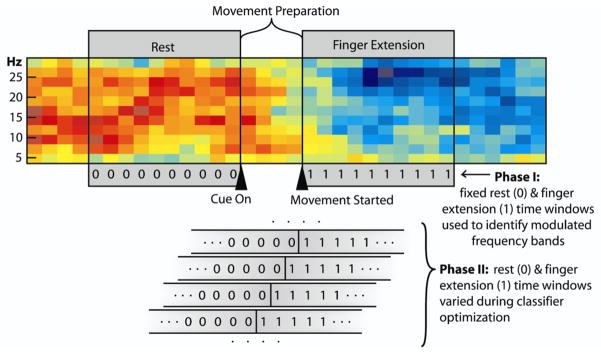
Figure 2.
Spectrogram from one channel of EEG showing epochs used in the different stages of analysis (red=higher power; blue=lower power). Triangles indicate initial presentation of the hand-open cue and movement onset. The two grey boxes spanning the spectrogram indicate the two one-second time segments used in Phase I of the analysis (i.e., the relaxed (0) and finger extension (1) epochs). Analysis in Phase II emphasized early detection of finger extension during the ‘movement-preparation’ epoch. The lower part of the figure shows how the assigned rest/finger-extension transition point (0-to-1) was systematically shifted across the movement preparation epoch in Phase II as part of the process of optimizing an early detection classifier.

