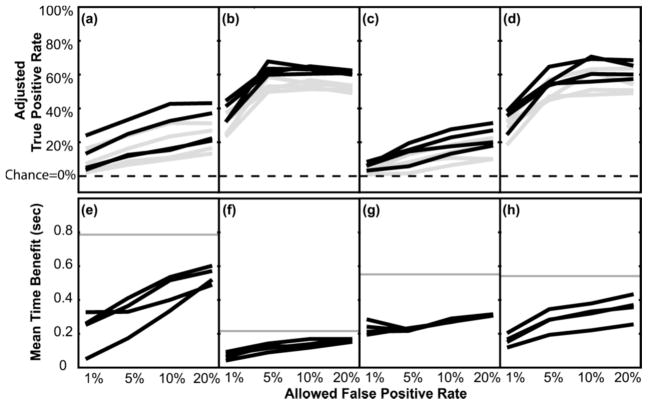
Figure 3.
Adjusted true positive rate and mean time benefit as a function of allowed false positive rate. (a–d) Adjusted true positive rates plotted separately for participants one through four (i.e., true positive rate during the movement-preparation phase minus the false positive rate during the rest phase. Note chance level =0% and is indicated by the dotted lines). Within each graph, each black line indicates a different testing session, and grey lines indicate the lower 95% confidence intervals for each session. (e–h) Corresponding average time benefit of using EEGs to trigger a device over using EMGs or bend sensor data alone. In e–h, grey lines indicate the maximum possible time benefit based on the length of each person’s movement preparation time.

