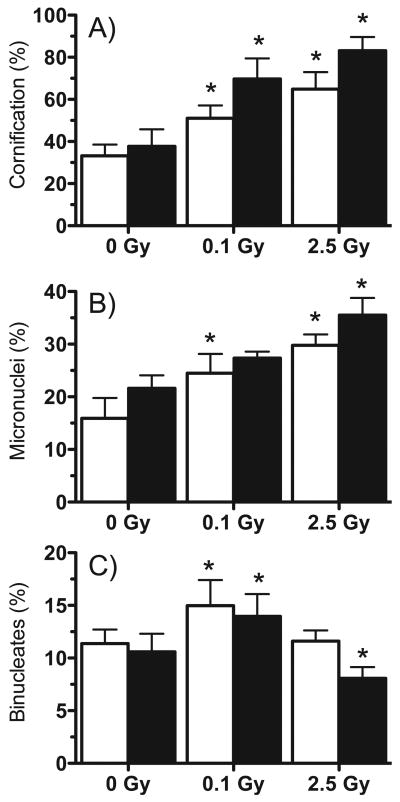
FIG. 2.
Structural changes in irradiated EPI-200. Tissues were irradiated with 0, 0.1 or 2.5 Gy protons and examined 48 h (white bars) and 72 h (black bars) later. Panel A: Ratio of cornified layer to total tissue thickness. Panel B: Percentage of binucleate cells with micronuclei. Panel C: Percentage of binucleated cells in the basal layers as an indicator of proliferation. All results are means ± SEM (n = 6); (*) indicates significant difference from time-matched controls (P < 0.01).

