
FIG. 3.
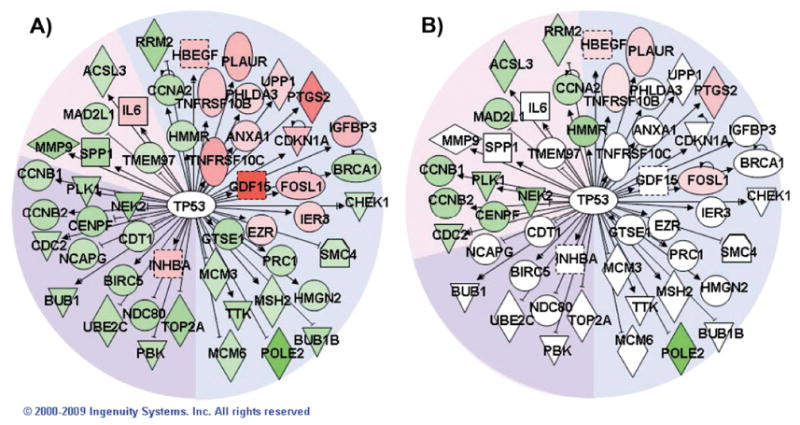
Network of TP53-regulated genes. Pathway Explorer was used to build a network of all transcriptional targets of TP53 from the Ingenuity Knowledge Base (IPA) that were differentially expressed after irradiation with 2.5 Gy. The nodes were colored by overlaying significant expression ratios from the data for 2.5 Gy (panel A) or 0.1 Gy (panel B), with red indicating upregulation and green downregulation. The time after irradiation when a response was observed is indicated by the background shading of the figure (blue: 4 h, pink: 16 h, purple: both 4 and 16 h). Additional TP53 targets also responded to the higher dose at 24 h, but none of those genes responded significantly to the lower dose.