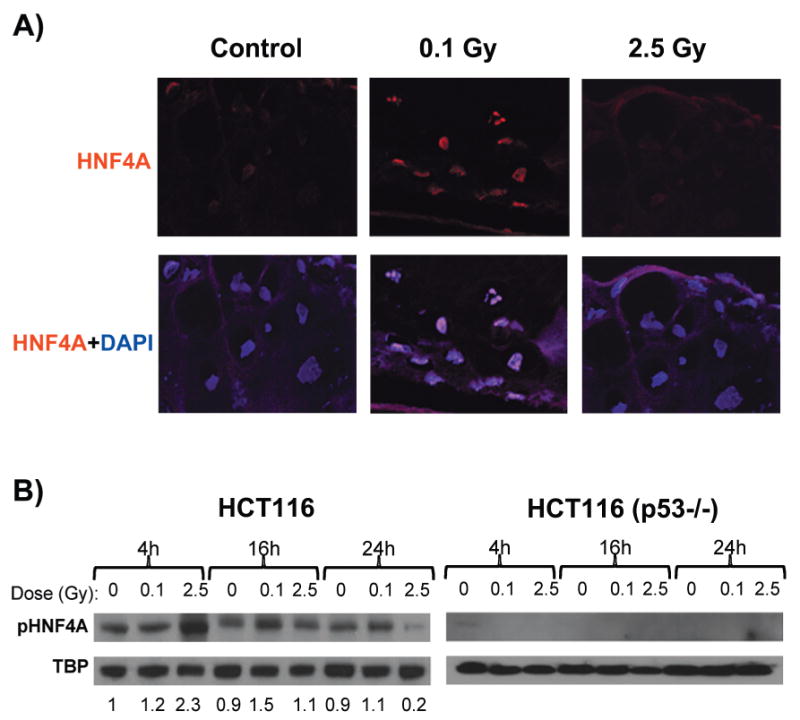
FIG. 5.

Detection of HNF4A protein. Panel A: Tissues fixed 16 h after exposure (control or 0.1 Gy). HNF4A staining was detected with Texas Red conjugated secondary antibody (red), and nuclei were counterstained (blue) with DAPI (original magnification 600×). Panel B: Western blot analysis of HNF4A phospho-Ser142 (pHNF42A) expression in HCT116 and HCT116 p53−/− nuclear extracts at 4, 16 and 24 h after exposure (control, 0.1 Gy or 2.5 Gy). Results are normalized to TATA-box binding protein (TBP), and relative change ratios compared to the 4-h control are indicated beneath each lane for HCT116. Both HNF4A and pHNF4A were expressed at very low levels in the p53−/− cells.
