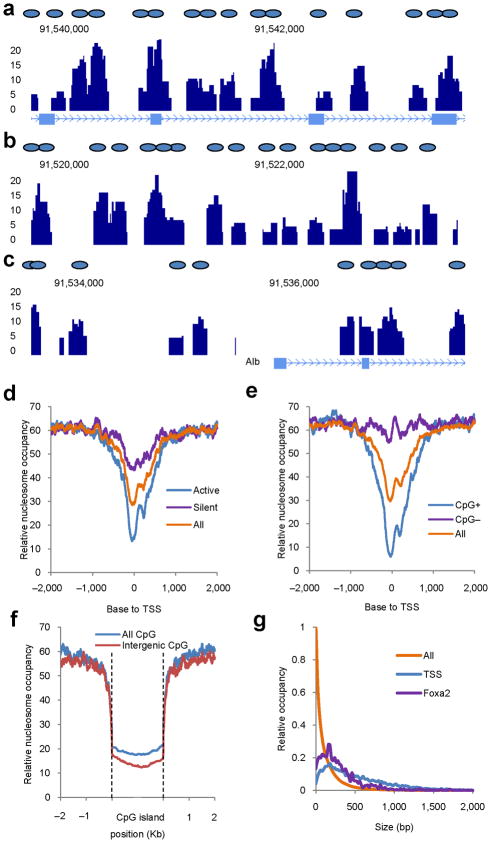
Figure 2.
Nucleosome dynamics in the mouse liver. (a–c) Nucleosome map of the mouse liver. Stack height profiles of nucleosome reads represent nucleosome occupancy in the gene body (a), enhancer (b) and surrounding the transcriptional start site (TSS) (c) of the Albumin gene. Blue ovals represent putative nucleosome positions. (d) Nucleosome distribution surrounding transcriptional start sites (‘All’, all annotated genes from the UCSC genome database; ‘Active’, 1,000 genes with the highest expression in the liver; ‘Silent’, 1,000 genes with no expression in the liver. (e) Nucleosome distribution surrounding TSS of genes associated with (CpG+) and without (CpG−) CpG islands. (f) Nucleosome distribution surrounding CpG islands. Either all CpG islands or those located more than 5 Kb distant to the nearest gene (Intergenic) were analyzed. (g) Sizes of nucleosome-free regions at Foxa2 binding sites, surrounding transcriptional start sites, or in the whole genome (All).

