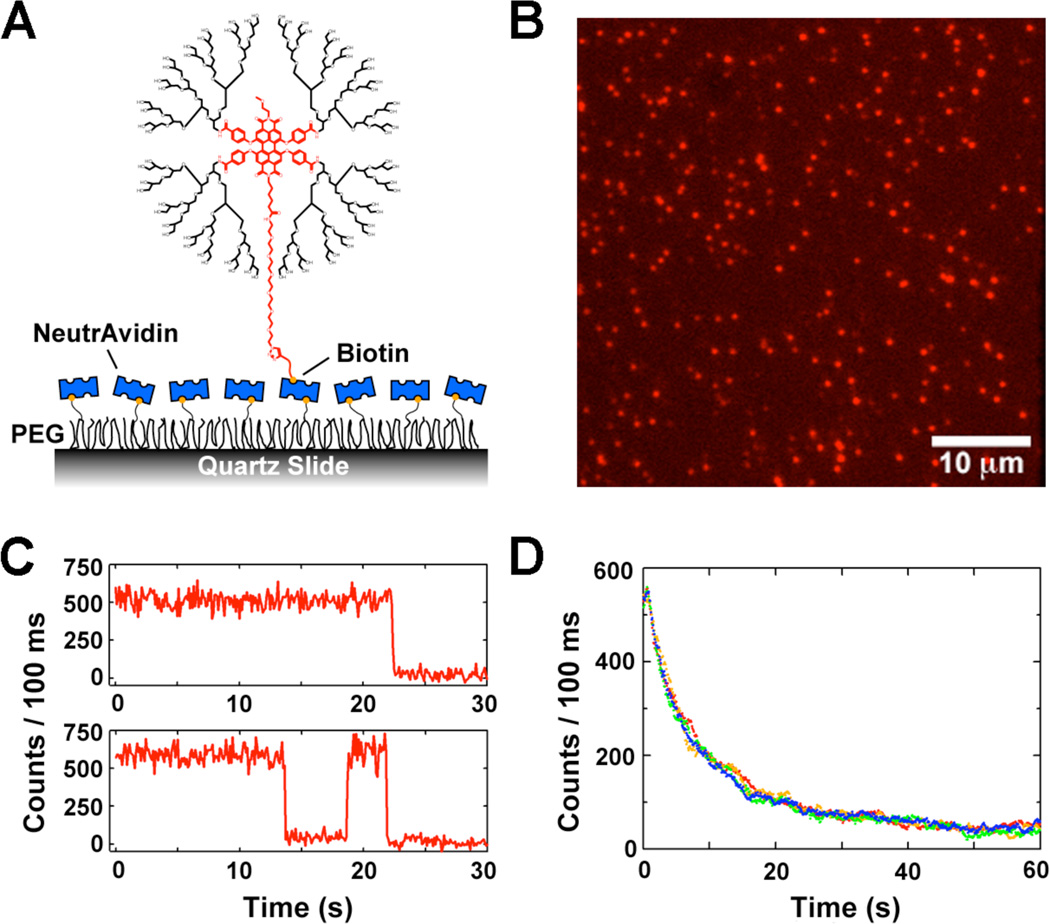
Figure 4.
Single-molecule analysis of PGD-PDI 4. (A) Experimental scheme, in which 4 is immobilized on a PEG-coated surface through biotin-neutravidin linkages. (B) Fluorescence image of immobilized molecules with pseudo colors. (C) Typical fluorescence intensity time traces of individual molecules in T50 buffer. (D) Average fluorescence intensity as a function of time in T50 buffer.

