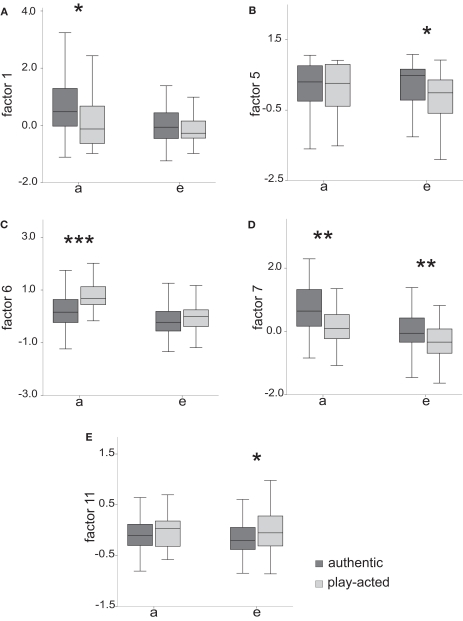
Figure 1.
Differences in the factor loadings between authentic and play-acted speech tokens. Given are the median, the lower, and the upper quartile. Whiskers represent the values within the 1.5 interquartile range. The figures (A) to (E) represent the 5 factors that varied in the SOURCE condition. The asterisks mark the significant levels of the differences found by the LMMs (*<0.05, **<0.01, ***<0.001).

