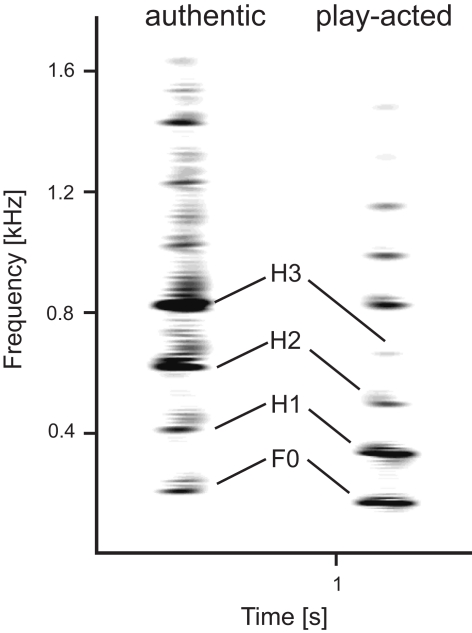
Figure 2.
Differences in the energy distribution of the lower frequency bands between authentic and play-acted utterances. The authentic stimulus possesses high amplitude ratios between the second harmonic and the F0 (amprat 2 = 3) and between third and first harmonic (amprat 3 = 2.71), while the play-acted stimulus is characterized by lower values (amprat 2 = 0.28, amprat 3 = 0.3). The differences in the F0 positions are due to individual differences. Given are the FFT spectrograms of one authentic and one play-acted female spoken “a” with a sampling rate of 2.7 kHz (Avisoft-SASLabPro).

