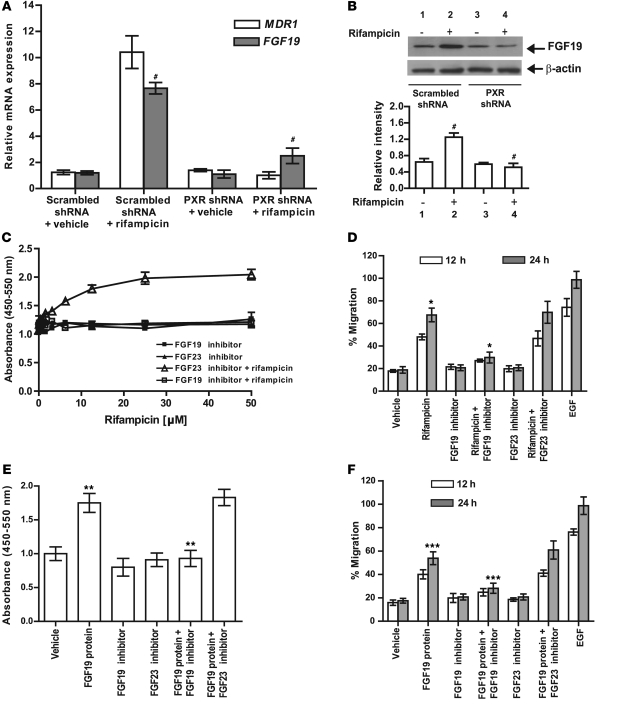
Figure 2. LS174T cell proliferation and migration in response to PXR activation are mediated by induction of FGF19 expression.
(A) Real-time quantitative PCR (QPCR) of FGF19 and MDR1 in LS174T cells expressing either scrambled shRNA or PXR shRNA (stimulated with either rifampicin [10 μM] or vehicle). Gene expression changes were calculated using comparative Ct method, with β-actin as the reference gene and scrambled shRNA plus vehicle as the calibrator. (B) Representative immunoblot analysis of FGF19 from LS174T cells (as in A) exposed to rifampicin (10 μM) or vehicle, with β-actin as loading control. Absolute band intensity (ImageJ; http://rsbweb.nih.gov/ij/) is plotted as a function of lanes from immunoblots. (C) Proliferation of LS174T cells exposed to rifampicin (0–50 μM), FGF23 inhibitor (400 ng/ml), and FGF19 inhibitor (400 ng/ml) as illustrated. (D) Transwell migration assay in the presence or absence of rifampicin (25 μM) or vehicle alone or in combination with FGF19 inhibitor (400 ng/ml) or FGF23 inhibitor (400 ng/ml). (E) Proliferation of LS174T cells that had been stimulated with FGF19 protein (1,000 ng/ml), with or without FGF19 inhibitor (400 ng/ml) or FGF23 inhibitor (400 ng/ml). (F) Transwell migration assay performed with LS174T cells stimulated with rifampicin (25 μM) or vehicle alone or in combination with FGF19 inhibitor (400 ng/ml) and FGF23 inhibitor (400 ng/ml) as illustrated. Data are presented as mean ± SEM. (A and C–F) n = 4 in triplicate; (B) n = 3. DMSO (0.2%) was the vehicle for all in vitro experiments. #P < 0.001, *P < 0.001, **P < 0.001, ***P < 0.001.

