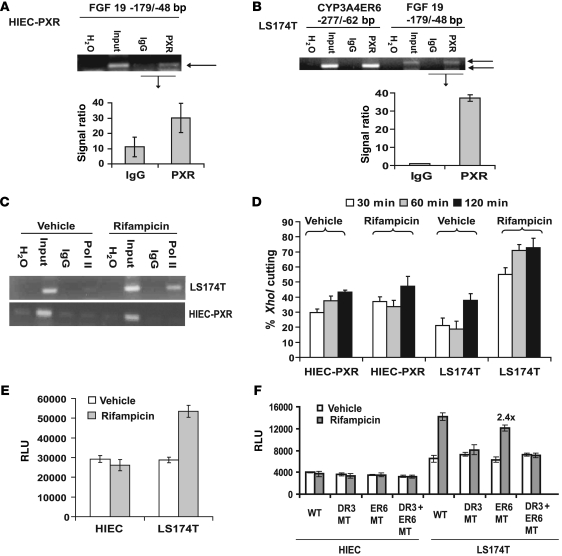
Figure 7. PXR binds to the endogenous FGF19 promoter and recruits RNA Pol II in LS174T cells.
ChIP analysis of PXR in (A) HIEC-PXR and (B) LS174T cells. The ChIP analysis was performed 5 separate times (each time in duplicate) for QPCR and plotted as a signal ratio between the PXR and IgG lane (FGF19) as illustrated. (C) Pol II bound to endogenous FGF19 promoter in LS174T cells and HIECs overexpressing PXR (HIEC-PXR). (D) XhoI chromatin accessibility assay by real-time PCR (CHART-QPCR) was performed using cell nuclei from rifampicin- or vehicle-treated LS174T and HIEC-PXR cells (for primer sequence details, see Supplemental Table 1). The nuclei were treated with XhoI for 30 to 120 minutes. The XhoI accessibility was expressed as a percentage of the uncut DNA and is plotted against the time of XhoI digestion. All experiments were repeated at least 3 independent times, each in triplicate. CHART-QPCR assays were performed 4 independent times, with 6 repeats per assay point. (E) PXR transactivation assay was performed in LS174T cells and HIECs using the –2,216-bp FGF19 reporter (n = 3 in triplicate). (F) The PXR transactivation assay was performed in LS174T cells and HIECs using FGF19 promoter (–2,216-bp) wild-type, DR3 mutant, and/or ER6 mutant reporter constructs (n = 3 in triplicate). Data are presented as mean ± SEM (± SD is shown for ChIP QPCR data). DMSO (0.2%) was the vehicle for all in vitro experiments. “2.4x” indicates a 2.4 fold change compared with that of vehicle.

