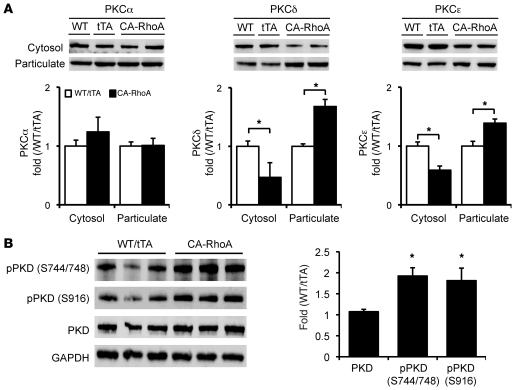
Figure 4. nPKC isozymes and PKD are activated in CA-RhoA hearts.
(A) Representative blots and quantification of cytosolic and particulate PKCα, PKCδ, and PKCε fractionated from the LV of WT, tTA, and CA-RhoA hearts (8 weeks off Dox). *P < 0.01 (n = 3–6). (B) PKD phosphorylation (pPKD) and expression in LV lysates from WT, tTA, and CA-RhoA hearts (8 weeks off Dox). *P < 0.01 (n = 6). Data are shown as mean ± SEM.

