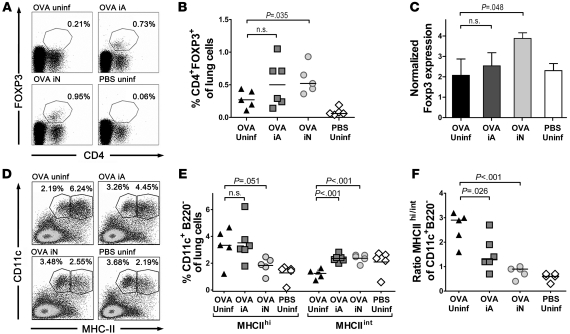
Figure 2. Tregs and semimature DCs accumulate in the lungs of neonatally infected mice.
Groups of mice treated as described in Figure 1 were analyzed with respect to lung infiltration by FoxP3+ Tregs and CD11c+B220– DCs. (A and B) Representative scatter plots and quantification of CD4+FoxP3+ cells in lung preparations of 4–6 mice per group; percentages in A denote the fraction of CD4+FoxP3+ cells of all lung cells. (C) foxP3 expression of the mice shown in B, normalized to GAPDH. (D and E) Representative scatter plots and quantification of CD11c+B220– DCs expressing high and intermediate levels of MHCII; percentages in D denote the fractions of MHCIIhi and MHCIIint cells of all CD11c+B220– lung DCs. (F) Ratios of MHCIIhi/MHCIIint DCs as calculated per mouse. All group data of methacholine measurements are presented as mean ± SEM. Total cell and eosinophil counts in BALF are presented for individual mice, with horizontal bars indicating group medians. Inflammation scores and PAS+ cells are represented by box and whisker plots, with horizontal bars representing medians and whisker ends indicating minimal and maximal values. Cytokine measurements and PCR results are presented as group mean ± SD.

