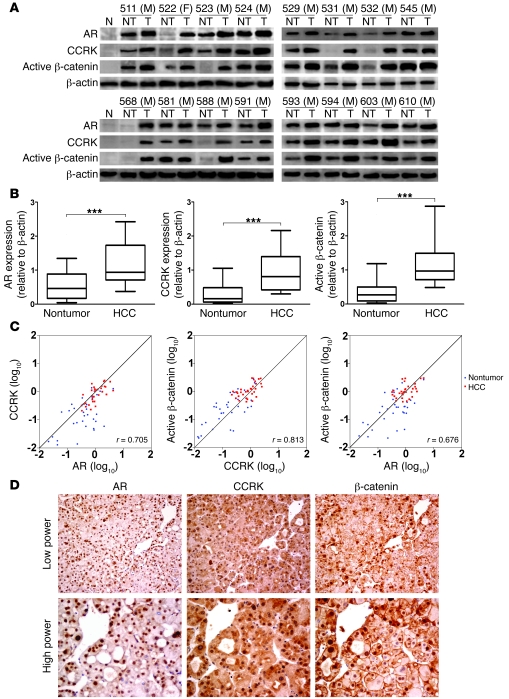
Figure 9. CCRK overexpression correlates with AR and active β-catenin levels in human HCCs.
(A) Western blot analysis of AR, CCRK, and active β-catenin in 16 representative primary HCC tissues (T) and their paired nontumor (NT) tissues as well as 2 normal liver specimens. β-actin was used as a loading control. M, male; F, female. (B) Relative protein expression levels of AR, CCRK, and active β-catenin in 33 paired HCC and nontumor tissues. The boxes represent the interquartile range; lines within boxes and whiskers denote median and 10–90 percentiles, respectively. (C) Correlation among AR, CCRK, and active β-catenin in 33 paired HCCs and matched nontumor tissues denoted with Pearson’s correlation coefficients. (D) Immunohistochemical staining of AR, CCRK, and β-catenin in the serial sections of a representative HCC case (#532M). AR staining showed strong nuclear positivity in the tumor cells. CCRK staining of the same area showed moderate strong cytoplasmic perinuclear positivity, while scattered nuclear positivity was also noted. β-catenin staining of the same area showed strong nuclear positivity. Original magnification, ×200 (low power); ×400 (high power). ***P < 0.0001. Data are presented as mean + SD of 3 independent experiments.

