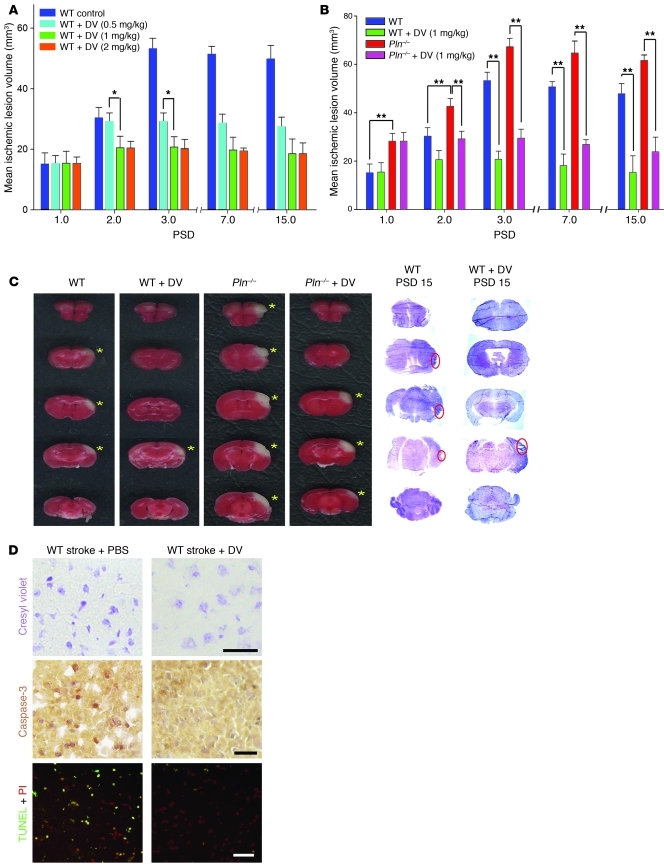
Figure 3. DV is neuroprotective.
(A and B) Mean ischemic lesion volumes measured from brain sections stained with TTC (PSD 1–3) or H&E (PSD 7 and 15) in WT mice treated with different doses of DV (A) or in WT and Pln–/– mice treated as indicated (B) (*P < 0.05, **P < 0.01, n = 15 per treatment group per PSD). (C) WT or Pln–/– mouse brain TTC staining at PSD 3, or WT H&E staining on PSD 15, after animals received i.p. PBS or DV injections (1 mg/kg). Yellow asterisks and red circles indicate ischemic lesions. (D) Cresyl violet, cleaved caspase-3, and TUNEL staining, with propidium iodide (PI) nuclear counterstain, in the peri-infarct area in WT mice treated with PBS or with DV. Scale bars: 5 μm (cresyl violet) and 10 μm (caspase-3 and TUNEL).

