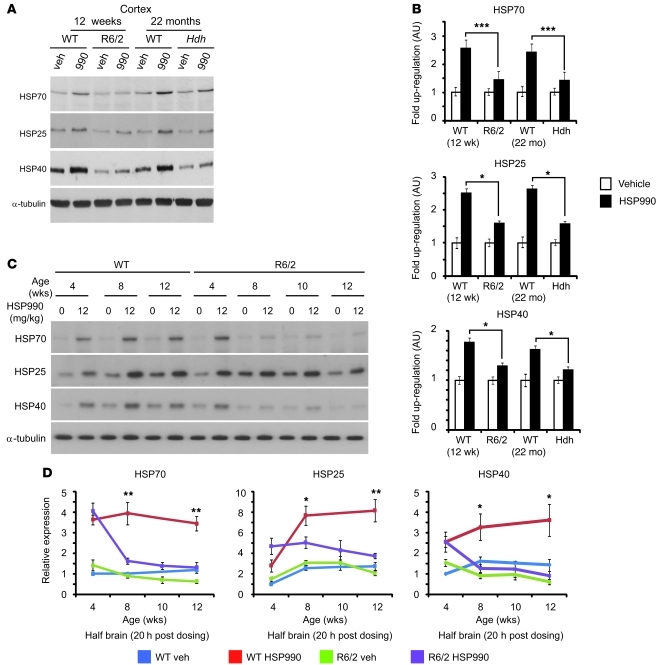
Figure 3. HSP upregulation is impaired in HD mouse models.
(A) Representative Western blots of HSP70, HSP25, HSP40, and α-tubulin expression in WT, R6/2 or HdhQ150/Q150 (Hdh) cortex 20 hours after treatment with vehicle or HSP990 (12 mg/kg). (B) Immunoblotting and densitometry were used to calculate the expression levels of HSP70, HSP25, and HSP40 in mouse cortex relative to levels of α-tubulin. Fold expression of each chaperone was calculated for HSP990 relative to vehicle. Values are mean fold ± SEM (n ≥ 4 per treatment group). (C) Representative Western blots of HSP70, HSP25, HSP40, and α-tubulin in half brain of 4-, 8-, 10-, and 12-week-old WT or R6/2 mice 20 hours after treatment with vehicle or HSP990 (12 mg/kg). (D) Relative expression of HSP70, HSP25, and HSP40 at 20 hours after treatment with HSP990 (12 mg/kg) or vehicle, calculated relative to α-tubulin by densitometry. Fold expression relative to vehicle-treated 4-week-old WT mice was calculated for each chaperone and age, and values are mean ± SEM (n = 4). *P < 0.05, **P < 0.01, ***P < 0.001, Student’s t test.

