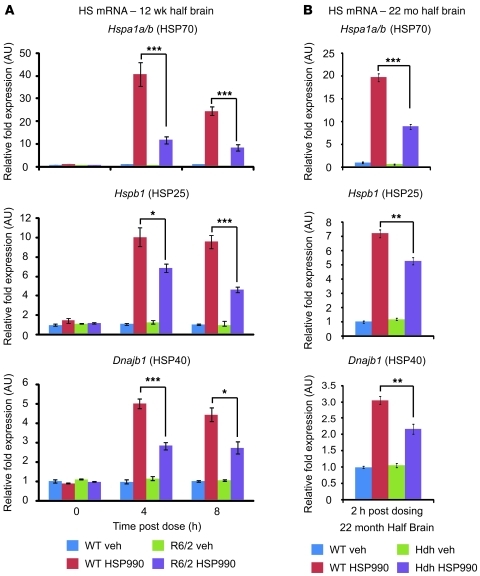
Figure 4. Impaired upregulation of HSPs occurs at the level of transcription.
Taqman RT-qPCR of Hspa1a/b, Hspb1, and Dnajb1 was performed on half brains of 12-week-old WT and R6/2 mice 0, 4, or 8 hours after treatment with vehicle or HSP990 (12 mg/kg) (A), or on half brains of 22-month-old WT and HdhQ150/Q150 mice 2 hours after treatment with vehicle or HSP990 (B). (Due to the reduced availability of mice aged 22 months, HdhQ150/Q150 analysis was performed at 2 hours after dose to allow investigation of mRNA levels and chromatin architecture on the same samples.) Chaperone mRNA expression levels were normalized to the housekeeping gene Atp5b. Fold induction of each HS gene after HSP990 treatment was calculated relative to expression levels of WT vehicle groups 0 hours after treatment, and expressed as mean fold ± SEM (n = 4 per treatment group). *P < 0.05, **P < 0.01, ***P < 0.001, Student’s t test.

