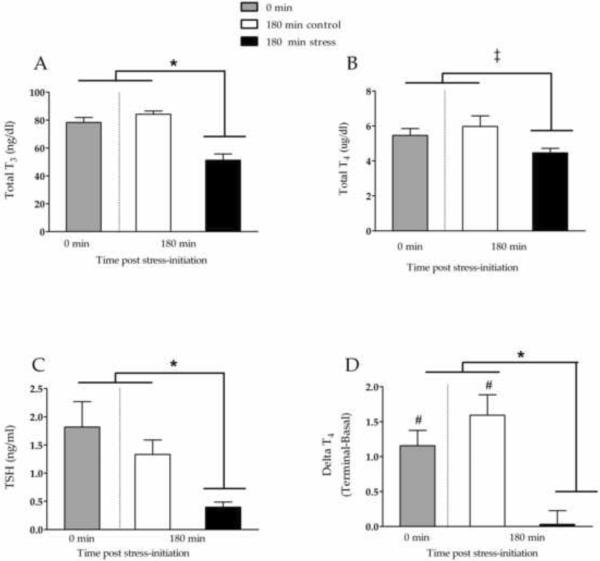
Figure 3.
Total T3 (A), total T4 (B), and TSH (C) measured in terminal serum samples collected from adult male rats 180 min after inescapable tail-shock stress (solid bars) or control manipulations (open bars), or without experimental manipulation (0 min). Change in Total T4 from basal samples (day 1) to terminal samples (day 2) are shown in panel D. Separate paired samples T-Tests indicated that terminal T4 was higher than basal T4 in 0m and 180m controls (denote with #), but not 180m stress animals. All between-group comparisons were made using a one-way ANOVA and Bonferroni-corrected post-hoc tests, with * denoting significant differences with p < .05 and ‡ denoting statistical trends with .1 < p < .05. Values are graphed as mean ± s.e.m.

