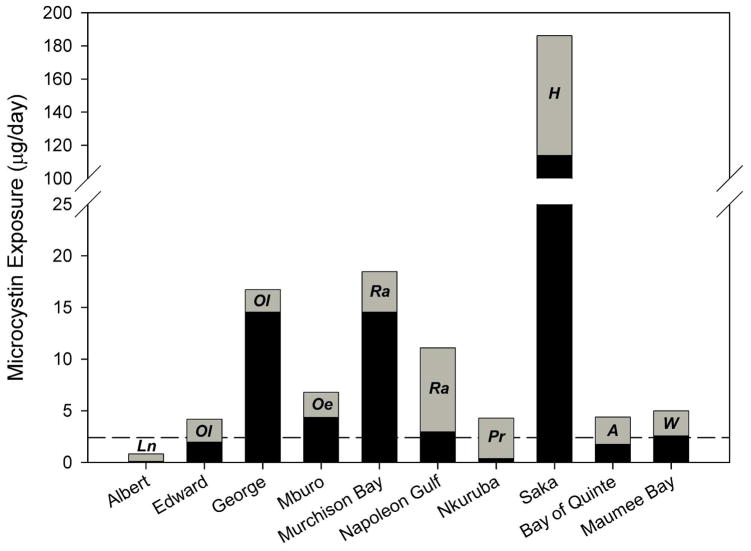
Figure 3.
Potential daily microcystin exposure for individuals consuming water and fish from the study lakes. The reference line indicates the threshold value at which a 60 kg consumer would exceed the WHO TDI (2.4 μg/day). Exposure from water is indicated in black, and is based on daily consumption of 2 L using mean microcystin concentrations in water. Exposure from fish is indicated in grey, and is based on daily consumption of 100 g using mean microcystin concentration in the fish taxa with the highest mean concentrations. The species used in calculating exposure from fish are indicated as follows: Ln (Lates niloticus), Ol (Oreochromis leucostictus), Oe (Oreochromis esculentus) Ra (Rastrineobola argentea), Pr (Poecelia reticulata), H (Haplochromis spp.), A (alewife), and W (walleye).

