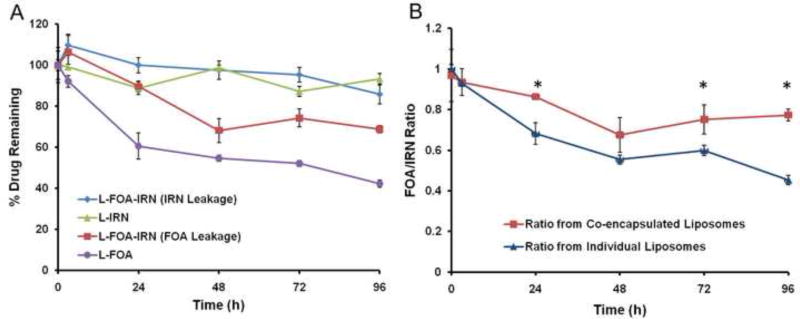
Figure 4.
FOA and IRN release profile from L-FOA-IRN, L-IRN, and L-FOA. A. In vitro leakage from liposomes during 96 hr incubation in 33% serum at 37°C. B. Ratio of IRN and FOA released from the co-encapsulated and the individual liposomes over time. *Statistical significance (P < 0.05) between the ratio from co-encapsulated and separate liposomes as measured by Student’s t-test.

