Figure 1.
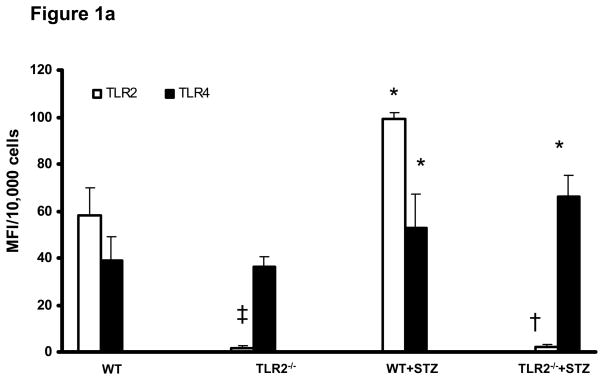
Figure 1a: Surface expression of TLR2 and TLR4: Peritoneal macrophages were obtained from WT (n=5), TLR2−/− (n=5), WT+STZ (n=20) and TLR2−/−+STZ (n=22) mice at 6 weeks and surface expression of TLR2 and TLR4 were assessed by flow cytometry as described in Methods. Values are expressed as MFI/10,000 cells (mean ± SD). *P<0.001 vs WT and TLR2−/−; †P<0.001 vs WT or WT+STZ; ‡P<0.05 vs WT.
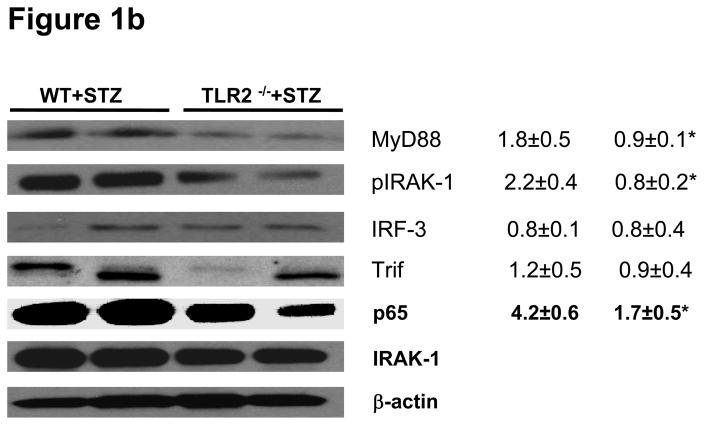
Figure 1b: TLR2-MyD88 dependent signaling: MyD88, IRAK-1 phosphorylation, IRF3, Trif, and nuclear p65 protein levels were measured in peritoneal macrophage lysates from WT+STZ (n=20) and TLR2−/−+STZ mice (n=22) at 6 weeks using Western lot assay. Representative blots with densitometric ratios were depicted in the figure. Values are expressed as protein/β-actin ratio (mean± SD). *P<0.001 vs WT+STZ mice. Total IRAK-1 and β-actin were used as internal controls.
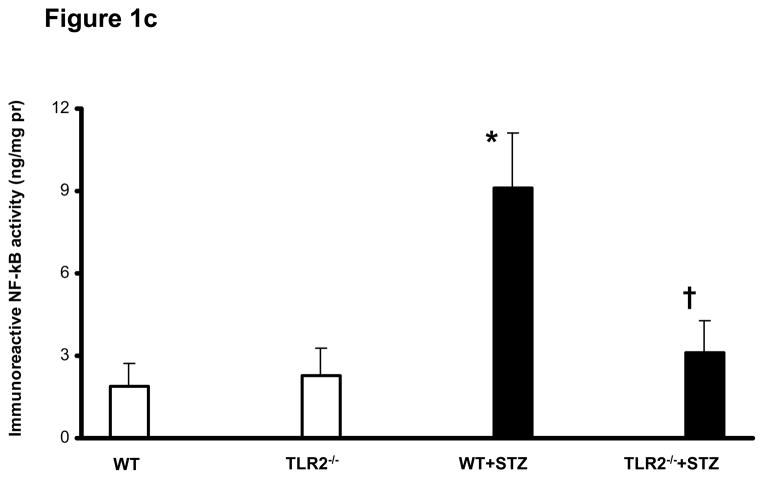
Figure 1c: Nuclear NF-kB activation in peritoneal macrophages of WT (n=5), TLR2−/− (n=5), WT+STZ (n=20) and TLR2−/−+STZ (n=22) mice at six weeks was determined by Trans-AM activity assay and normalized to nuclear protein as described in Methods. Values are expressed as ng/mg protein (mean ± SD). *P<0.005 vs WT and TLR2−/−; †P<0.001 vs WT+STZ mice.


