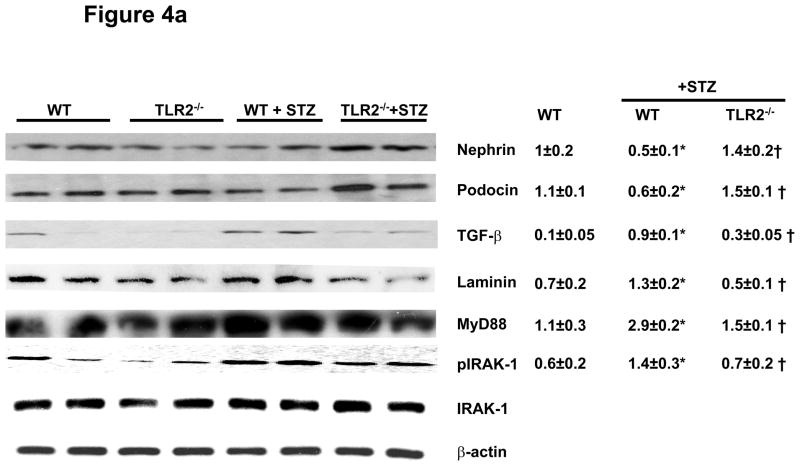
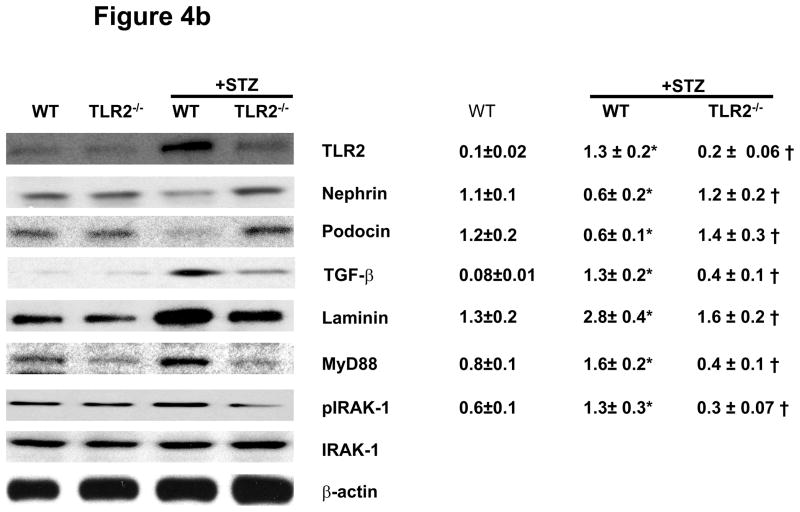
Figure 4.
Figure 4a: Slit diaphragm proteins Nephrin, Podocin and Extracellular matrix (ECM) proteins TGF-β, Laminin, MyD88, and IRAK-1 phosphorylation in kidney lysates of WT (n=5), TLR2−/− (n=5), WT+STZ (n=14) and TLR2−/−+STZ (n=16) at 6 weeks after diabetes were determined using Western blot. Representative blots with densitometric ratios were shown in the figure. Total IRAK-1 and β-actin were used as internal controls. Values are expressed as protein/β-actin ratio (mean ± SD). *P<0.005 vs WT; †P<0.02 vs WT+STZ.
Figure 4b: TLR2, Nephrin, Podocin, TGF-β, Laminin, MyD88, and IRAK-1 phosphorylation in kidney lysates of WT, TLR2−/−, WT+STZ, and TLR2−/−+STZ (n=11/gr) at 14 weeks after diabetes were measured in kidney tissue lysates using Western blot assay. Representative blots with densitometric ratios were depicted in the figure. Total IRAK-1 and β-actin were used as internal controls. Values are expressed as protein/β-actin ratio (mean ± SD). *P<0.001 vs WT mice. †P<0.05 vs WT+STZ.


