
Figure 3.
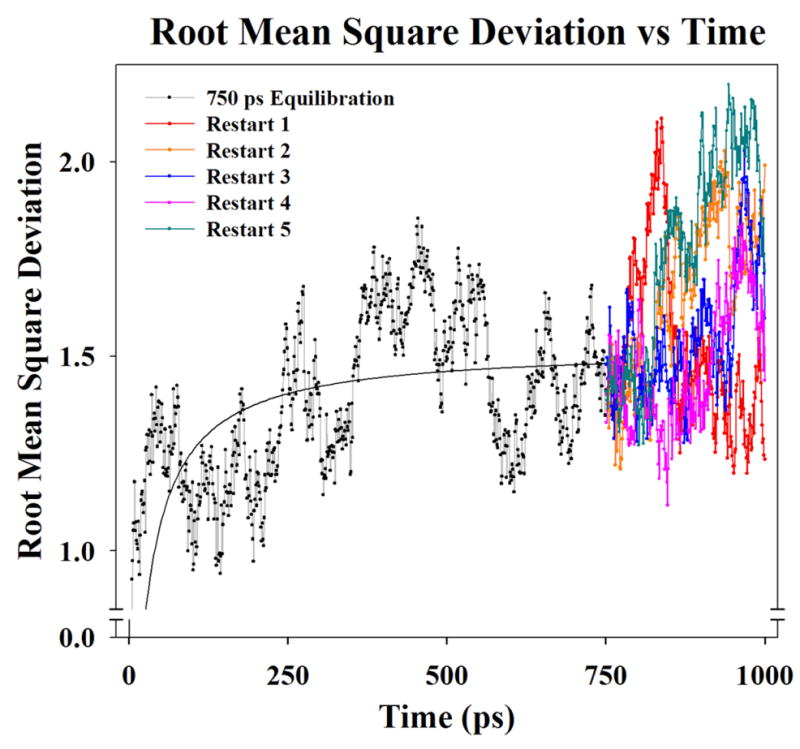
A plot of Root Mean Square Deviation showing peptide backbone movement during equilibration of collagen 1bkv peptide in solution. A two parameter hyperbola was fit to the data (solid black line from 0 – 750 ps) to help visualize the equilibration. The structure at 750 ps was then used as a restart point for five separate 250 ps simulations restarts (total duration of 1,000 ps of equilibration). Restarts were used to obtain an equilibrated starting structure of the unloaded collagen triple in a linear extended conformation without the use of an external steering force to straighten the molecule.