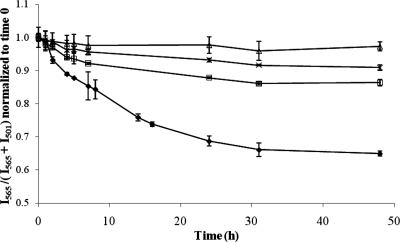
Figure 3.
The stability of FRET-micelle is compared to bovine serum albumin at various protein concentrations. Time traces of the FRET ratio normalized to time 0 in solutions of (Δ) 15 mg/mL BSA, (×) 45 mg/mL BSA, (◻) 90 mg/mL BSA, and (⧫) 100% FBS (n = 3 independent experiments, mean ± standard deviation are plotted).

