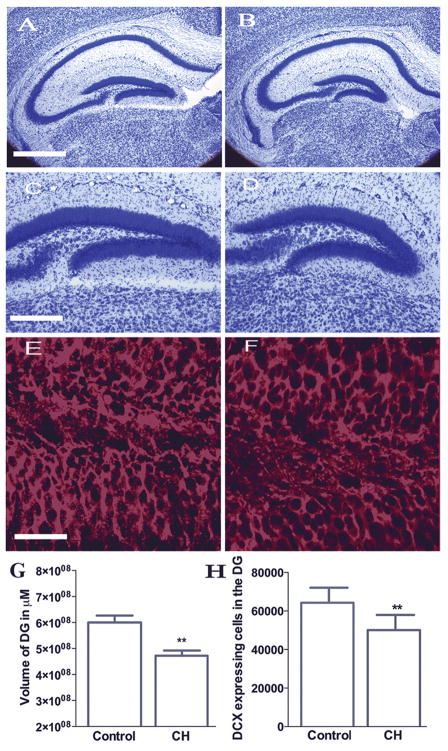
Figure 2. Decreased volume of the dentate gyrus and DCX-expressing late progenitors at P14 following CH.
Representative pictures of Nissl staining in control (A and C) and CH (B and D) mice at lower (A and B) and higher magnification (C and D) showing the volume of the DG. Volume estimation by MetaView analysis shows significantly decreased volume in the CH group (G). **P < 0.001. Error bars represent standard deviation and scale bars represent 200 μM (A and B) and 100 μM (C and D). Representative pictures of DCX staining in the DG at P14, in the control (E) and CH (F) showing significantly decreased number of cells under CH (H) as quantified by design-based stereology. **P = 0.001 to 0.01. Error bars represent standard deviation and scale bars represent 35 μM

