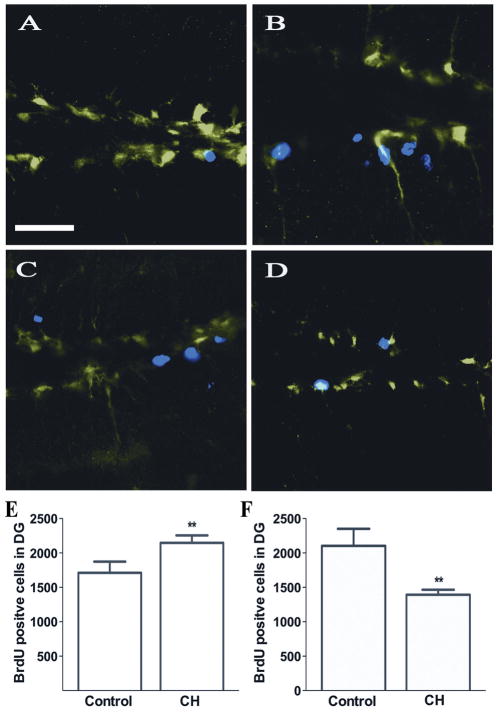
Figure 3. Changes in the number of actively dividing cells within the DG at P56 following CH.
Representative pictures of GFP and BrdU expression in the DG of mice under control (A) and CH conditions (B) shows a significant increase in the number of the BrdU-positive cells in the CH mice (E) as measured by design-based stereology. Mice were injected with BrdU at P28 just after being removed from hypoxic conditions and quantified 4 weeks later. Representative pictures of BrdU staining under control (C) and CH conditions (D) showing decreased number of BrdU-positive cells under CH (F) as measured by design-based stereology. Mice were injected with BrdU 2 hours prior to perfusion at P56. **P = 0.001 to 0.01. Error bars represent standard deviation and scale bars represent 35 μM.

